2010 was the world’s hottest year on record, with global temperatures 0.53°C above the long-term (1961-1990) average.
2011 started with a strong La Niña (perhaps the strongest since 1917), something which would normally result in global temperatures below the long-term trend. But this year is only slightly cooler than last year’s record, running about 0.1°C cooler so far. This places 2011 very close to conditions over the past decade, and reinforces that our planet continues to warm as a result of the enhanced greenhouse effect.
The warming trend over recent decades has not been uniform in time and space. Every year sees various extremes of climate, but the location of these extremes varies from year to year. Location is often influenced by El Niño, La Niña and other large-scale climate drivers (for example, an El Niño event will often result in drought in Australia, India and southern Africa, and floods on the west coast of the Americas).

Increasingly, warm extremes are outnumbering cold extremes as the influence of the background warming trend strengthens. Last northern summer, the most significant extremes were the Russian heatwave and Pakistan floods.
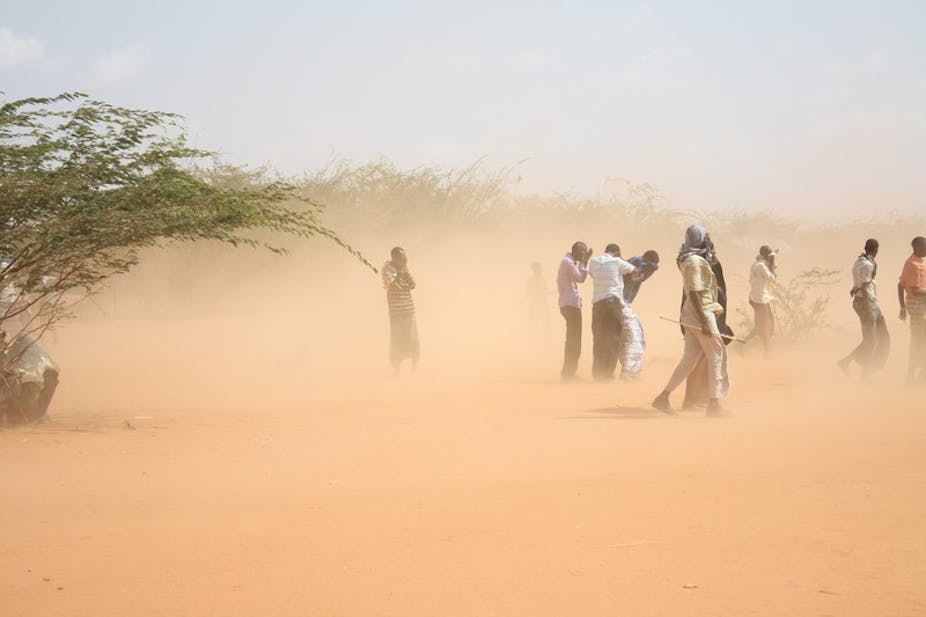
This year, while global temperatures have not reached last year’s record heights, there have been some very notable extremes in various parts of the world, including the Americas and Africa. The most significant of these events – at least in terms of human impact – has been the ongoing drought in east Africa.
East African drought
Equatorial east Africa has a somewhat unusual climate. Many tropical areas, such as northern Australia, large parts of southern and eastern Asia, or the Sahel region of west and central Africa, have a single wet season which peaks in the summer. In contrast, East Africa has two distinct wet seasons: the “long rains” from March to May, and the “short rains” in October and November. Dry conditions are the norm in between.
The current drought has focussed on a relatively small region about 600 kilometres across, covering the northeastern half of Kenya and adjacent parts of western Somalia and southern Ethiopia. In this area, after reasonable rains in the first half of 2010, rainfall was well below normal during the October/November 2010 wet season. This is quite common during a La Niña year.

However, rainfall has remained well below normal through the first half of 2011. The failure of two successive wet seasons is unusual and has played a major role in the severe food shortages in the region.
Rainfall in the northeastern half of Kenya for the past 12 months has been mostly about 50% below normal. For example, Mandera (near where Kenya, Somalia and Ethiopia meet), had about 140 millimetres in the year ending June compared to an average of 270 millimetres.
The deficits have intensified in the last few months with many parts of the region receiving less than a quarter of their usual rainfall for the March-May 2011 rainy season. Whilst no surface observations are available on the Somali side of the border, satellite data suggest that conditions there are similar to those in northeastern Kenya.

At present the drought is regarded locally as being comparable, in meteorological terms, with the droughts of 1983-84 and 1999-2000. That is, it’s among the worst of the last 60 years.
It would be highly unusual for any significant rain to fall in the region between now and the end of September, and hopes for recovery will be pinned on the next wet season, which would typically come in the months of October and November.
The drought is quite localised and west and central Africa have not been affected. Most of the Sahel region, which has suffered badly from droughts in the past, has seen near-normal rainfall so far in 2011.
American heat, drought and floods
Another region which has had more than its share of extreme weather and climate in recent months has been the United States.
For much of 2011, there has been a contrast between extreme drought in the south, and extreme wet conditions in the north.
The dry conditions have been focussed on Texas, which is experiencing the worst drought in its recorded history. Nearly all of the state, except the far south, is classified as being in exceptional drought (as are large parts of the adjacent states of Oklahoma and New Mexico). Statewide average rainfall for the year so far has been about 60% below normal, nearly 20% below the previous record. Some locations have had less than 20 millimetres rain since October 2010.

In marked contrast, spring was extremely wet in the inland northeast, as well as in Montana and the Dakotas. It was also extremely stormy with numerous destructive tornadoes: there was a record breaking count of more than 1000 in April alone.
These regions form the upper catchments of the Mississippi and Missouri rivers, and some of the most severe floods in decades have moved down the valley over the past few months – somewhat ironically, there has been major flooding in Louisiana despite the fact that Louisiana itself is having its second-driest year on record and is affected by severe drought.
In recent weeks extreme heat has also been a regular feature in the United States. Again the most extreme heat has been in Texas and Oklahoma, both of which are having their hottest summer on record, as has the broader south-central climate region. Temperatures have regularly reached the low to mid-40s.

Dallas recently ended a run of 40 consecutive days above 100°F (37.8°C), and has had five nights where the temperature failed to fall below 30°C. This had not happened even once before 2011.
Further north and east the heat has been less continuous, but almost equally extreme on occasions, with all-time record highs at places such as Newark (42.2°C), Baltimore (41.1°C) and Little Rock (45.0°C).
Over the nation as a whole, July 2011 was the fourth-warmest on record; only cool conditions in the northwest prevented more records from being set.
A notable feature of the American summer in the north-central states has been the high humidity which has accompanied the extreme heat. For example, humidity levels in the northern city of Minneapolis (at 45° north – equivalent to Dunedin in the far south of New Zealand) have reached a point as extreme as anything which has ever been recorded in Darwin.
Evaporation from large areas of standing water remaining from earlier floods has contributed to this. The copious available moisture in the northern states has allowed extreme short-period rainfalls to occur when conditions are favourable. Both Chicago (174 mm) and JFK Airport in New York (198 mm) set new all-time records for single-day rainfalls in the last month.
Is it climate change?
At the global scale, past warming now means that every year is well above the 1961-1990 average. This warming trend (estimated at around 0.15 to 0.2°C/decade) continues, and we anticipate that the record set in 2010 will likely be broken in the coming years.
The way this warming cascades through the climate system is both complex and significant, affecting the location, intensity and frequency of rain and storms, for example.
The relationship between climate change and rainfall extremes (both high and low) is complex and, in many regions, unclear. The past 15 years have been a rather dry period in east Africa but not yet to the extent that a long-term trend is obvious.
However, the dry conditions seen regularly in recent years in the southern United States parallel those in several other parts of the world at similar latitudes, notably southern Australia, parts of South America and the Mediterranean. These conditions have been linked to a poleward expansion of the subtropical high pressure zone. The United States also shows clearer evidence than many other parts of the world of an increase in the frequency of high rainfall extremes.
Marc Hendrickx
Geologist
The warming trend continues?
To be correct, perhaps you hold have said "Omitting the last ten years of stagnated global temperatures, the warming trend continues".
Mike Hansen
Mr
"According to NOAA scientists, 2010 tied with 2005 as the warmest year of the global surface temperature record, beginning in 1880. This was the 34th consecutive year with global temperatures above the 20th century average."
http://www.noaanews.noaa.gov/stories2011/20110112_globalstats.html
We have gone from "it has been cooling since 1998" to "temperatures are not rising". How long before we get "temperatures are not going up as fast as predicted"?
Marc Hendrickx
Geologist
"temperatures are not going up as fast as predicted"
As far as climate models go I guess that would count as evidence of a clear falsification.
Justin Wood
logged in via Facebook
Ah no, you'd have guessed wrong. It's something called a confidence interval range you see.
Mark Duffett
logged in via Facebook
Just another couple of data points. Hobart had its warmest end to July in over 120 years (http://www.smh.com.au/environment/weather/australias-warmest-end-to-july-in-decades-20110801-1i7be.html). And now August looks like it will top that (http://www.weatherzone.com.au/news/hobart-ending-winter-with-record-warmth/18649), not just beating the previous record for monthly averaged daily minima, but smashing it by over a degree.
Disclosure: I own real estate in Tasmania.
Gerald Thomas
Dr
Was 2010 really the hottest year on record? The last 5 months of 2010 were cooler than the corresponding 5 months in 2003 and 2011 is shaping up to be cooler than 2003 according to NASA sea surface temperatures. Trenberth kindly indicated in his chart of these a curving trend line, now starting to decline.
Please see my last post at http://theconversation.edu.au/the-jones-weightless-invisible-gas-trial-2955 where you'll find a link to our group site with Trenberth's chart at the top and possible reasons for the coming decline which Trenberth's trend clearly shows.
Stop worrying! The world will cool off.
Michael J. I. Brown
ARC Future Fellow and Senior Lecturer at Monash University
A classic example of cherry picking data.
Is 2003 (or just half of 2003) the new 1998?
Is Gerald Thomas the new Douglas Cotton?
Actually, Gerald Thomas is possibly an alias of the old Douglas Cotton. He is certainly spruiking Douglas Cotton's pseudo-science websites.
Gerald Thomas
Dr
Trenberth's trend (from Skeptical Science)
http://climate-change-theory.com/seasurface.jpg
did start in 1993 actually - ask him why he cherry-picked that.
http://skepticalscience.com/news.php?n=865
Marc Hendrickx
Geologist
Blair. I believe the worst drought on record for Texas, as measured by the Texas
Palmer Drought Severity Index (PDSI), and the Palmer Hydrological Drought Index occurred in the late 1950s. The record PDSI value according to the NOAA was registered in September 1956 with a value of -7.8. The current value at -7.25 for the month of July is getting close, but obviously not a record.
In terms of 12 month averages the figures between 1952 to 1957 are remarkable and surpass anything recorded since. Not…
Read moreMarc Hendrickx
Geologist
I note also Blair that the long term trend for Texas temperatures is just slightly negative, note also the difference between the last few years and that long drought period in the 1950s..
See...http://climvis.ncdc.noaa.gov/cgi-bin/cag3/hr-display3.pl
Blair Trewin
Climatologist, National Climate Centre at Australian Bureau of Meteorology
With any drought you can look at it on a variety of timescales. The 1950s certainly saw a more prolonged drought period than we have seen (yet) this time, with six successive dry years, but the 10 months October 2010 - July 2011 have been substantially drier than any individual 10-month period in the 1950s was (http://www.ncdc.noaa.gov/temp-and-precip/time-series/index.php?parameter=pcp&month=7&year=2011&filter=10&state=41&div=0). The 12-month figures don't look as dramatic because the current drought only really started in October; August and September 2010 were relatively wet.
Marc Hendrickx
Geologist
Blair, NOAA describes the PDSI in the following manner:
The Palmer Index is most effective in determining long term drought—a matter of several months—and is not as good with short-term forecasts (a matter of weeks). It uses a 0 as normal, and drought is shown in terms of minus numbers; for example, minus 2 is moderate drought, minus 3 is severe drought, and minus 4 is extreme drought.
On this basis, contrary to claims you have made above it appears that the current drought is not the "worst drought in recorded history".
Marc Hendrickx
Geologist
In regard to east African droughts this Nature article from 2000 (follow link below) provides some important historical perspective, missing from Blair's piece above.
http://www.ncdc.noaa.gov/paleo/africa-drought.html
Nature's Frank Oldfield puts the paper into context.
"A persistent and misleading myth is that climate variability has been minimal during the Holocene period, the present-day 'interglacial' that goes back 11,500 years."
(http://www.nature.com/nature/journal/v403/n6768/full/403370a0.html)
Mike Hansen
Mr
The article you refer to states
"all three severe drought events of the past 700 years were broadly coeval with phases of high solar radiation, and intervening periods of increased moisture were coeval with phases of low solar radiation"
Yes climate has changed before. What is different now is cause. Satellite measurement of solar irradiance indicate that the current global warming is not due to the sun.
As Lewandowsky and Ashley state
"The consensus opinion of the world’s climate scientists is that climate change is occurring due to human CO₂ emissions. The changes are rapid and significant, and the implications for our civilisation may be dire. The chance of these statements being wrong is vanishingly small."
http://theconversation.edu.au/the-false-the-confused-and-the-mendacious-how-the-media-gets-it-wrong-on-climate-change-1558
Paul Homewood
logged in via Facebook
If you think we are getting more extreme weather these days, compare it to 1971.
http://stevengoddard.wordpress.com/2011/08/03/essay-by-reader-paul-h-is-our-climate-becoming-more-extreme/
Mike Hansen
Mr
Paul. You state at the end of your article that lists extreme weather events for the two years.
"Which year saw the more extreme weather, 1971 or 2010? Who can say. How can anyone compare the severity of, say, a hurricane with that of a drought?"
I think that is generally true.
However the CEO of Munich Re, the world’s largest reinsurer who do keep quantifiable records stated in December 2010
"Climate change is a fact, and it is almost entirely made by man. It is jointly responsible for the…
Read moreIced Volvo
logged in via Facebook
All of these "extreme weather" articles have to be placed in the context of geologic history. We know, for example from sediments in the Gulf of Mexico, that any current weather/climate in this area is quite mild and that previous extremes make any current conditions pale into triviality in terms of intensity/frequency of storms, rainfall and T extremes.
As for the 1960-1990 (the usual 30 year moving avg I presume) this included the 1970s cool period an so any comparison will always show "above average" T.
As for "anticipate that the record set in 2010 will likely be broken in the coming years..." WHY? Extrapolation of some fitted curve outside of the boundaries is neither scientific nor useful. If however you are basing this on the computer models that is a whole other can of worms!
Mike Hansen
Mr
Yes. I agree. Let us put the current CO2 levels in the context geologic history.
"The last time carbon dioxide levels were apparently as high as they are today — and were sustained at those levels — global temperatures were 5 to 10 degrees Fahrenheit higher than they are today, the sea level was approximately 75 to 120 feet higher than today, there was no permanent sea ice cap in the Arctic and very little ice on Antarctica and Greenland,"
http://www.sciencedaily.com/releases/2009/10/091008152242.htm
Iced Volvo
logged in via Facebook
The geologic record I speak of is in the recent past i.e. the last millennia or two and the conclusion from those sediments is that any current events (i.e. the last decade or so or in fact the last century) are not "extreme" in any normal or scientific sense; rather they are actually quite mild in both strength and frequency.
CO2 levels are irrelevant to this discussion but are relevant to the models which, as I stated above, is a whole other can of worms.
Marc Hendrickx
Geologist
Blair,
Sorry to pick you up on yet another point. I am guessing you didn't make up the headline, as these extremes are extremes of weather, not climate.
Andrew Glikson
Earth and paleo-climate scientist at Australian National University
Marc H
The distinction between "weather" and "climate" depends on at least two paameters:
1. Time scale
2. Geographic extent
Climate change, observed as trends on the scale of decades, far from an abstract trend, is manifested in series of local and transient weather events.