

Successive Australian governments are usually judged on how they balance the budget and spend taxpayers’ dollars. The stereotypes are that Liberal governments keep a tight hold on the purse strings, while Labor governments are spendthrifts.
While total government spending has increased from around A$240 billion in 1998-99 to a predicted A$451 billion in the 2016-17 financial year, it’s also accompanied by an increase in revenue from around A$250 billion to A$417 billion over the same period.
But the pressure on the budget under a Turnbull government is more acute now than ever before, because spending is outpacing revenue. It’s now at an estimated 26.6% of GDP in 2016-17, higher than at any point since before the start of the millennium.
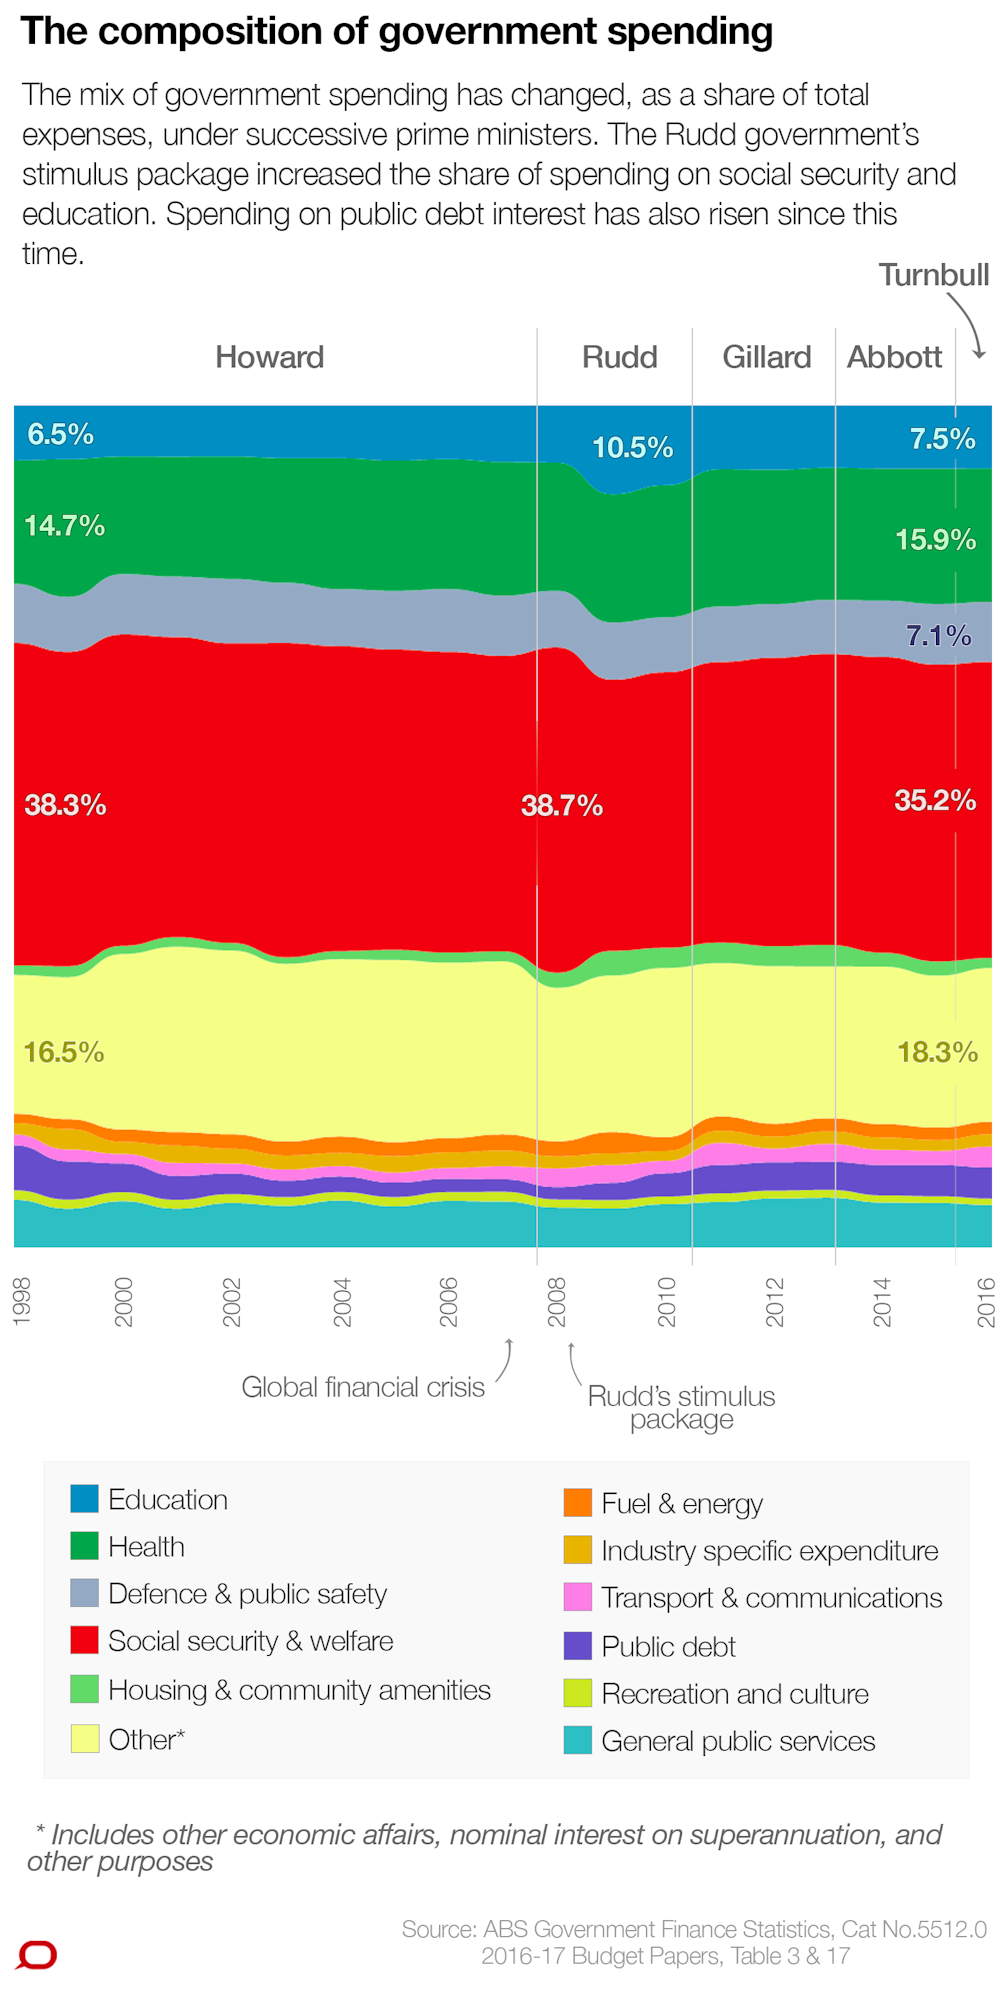
When you look at the mix of government spending over the past fifteen years, you start to see some of the drivers of the growth.
To compare spending over time, we have adjusted for the effect of inflation by using real measures.
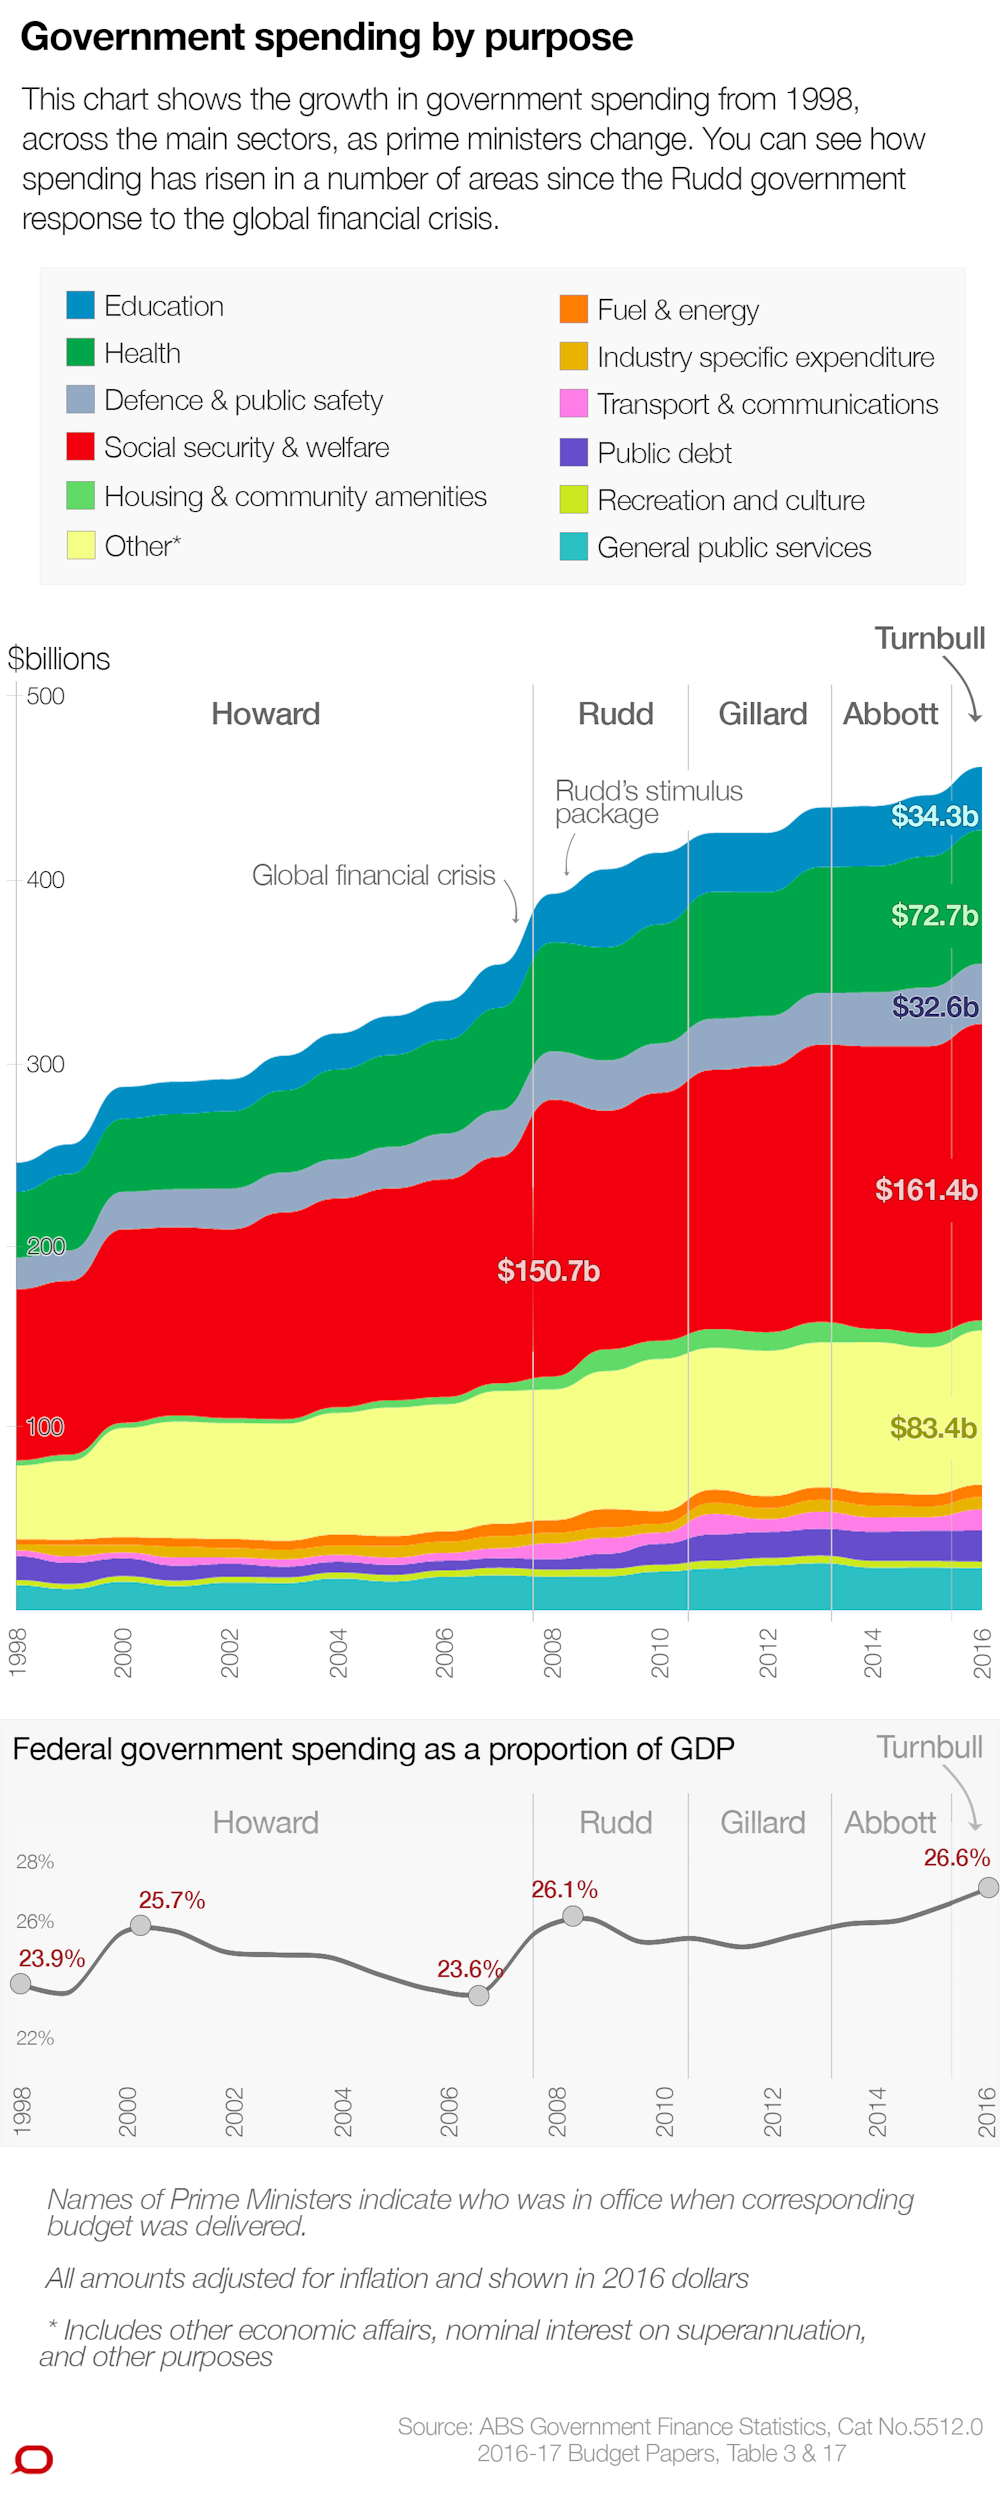
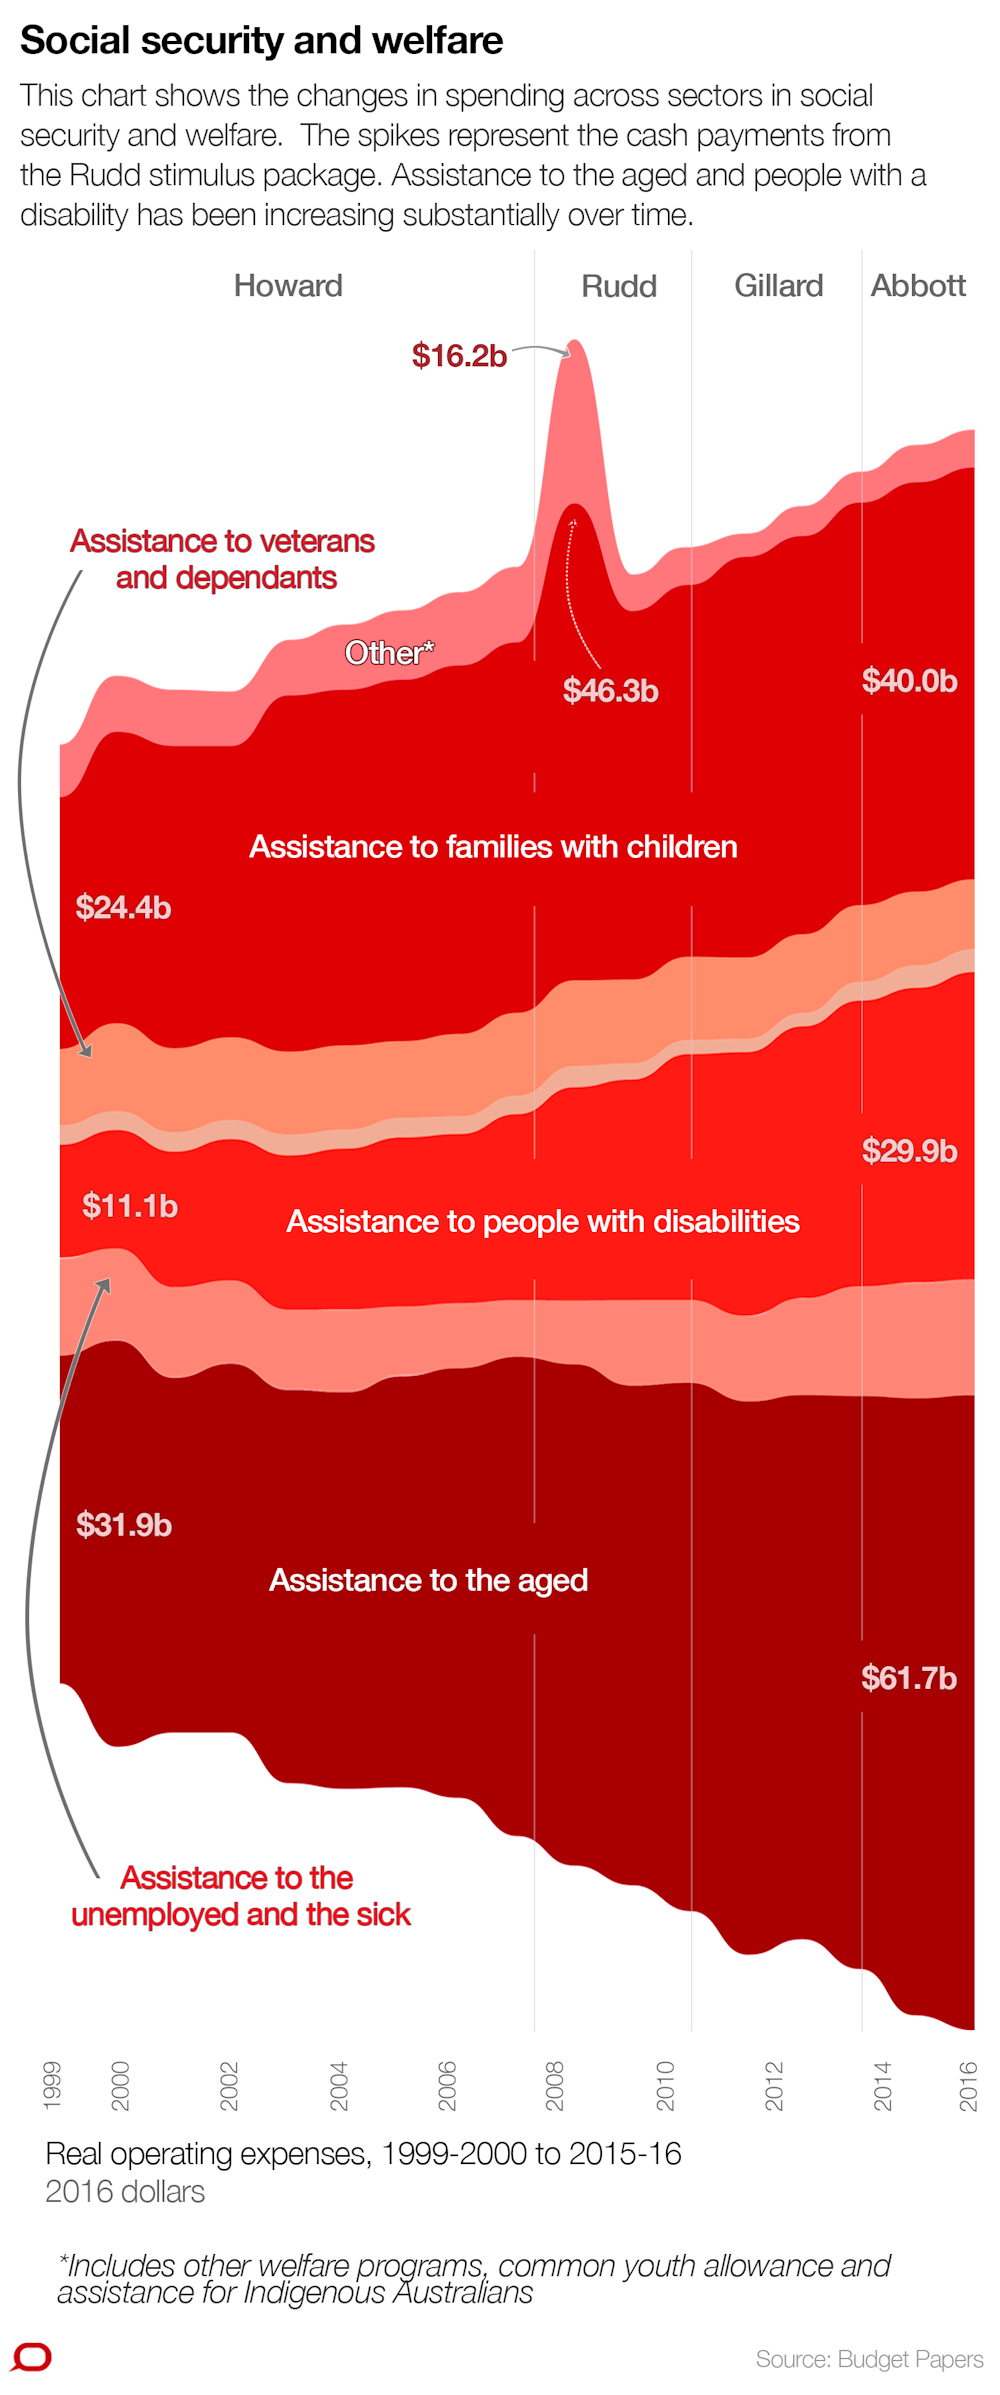
Social security continues to dominate government spending at A$161.4 billion, constituting around 35% of all government outlays on latest figures. This has fallen from a high of 39% during the Rudd government stimulus package in 2009-10 and is similar to levels at the beginning of the millennium.
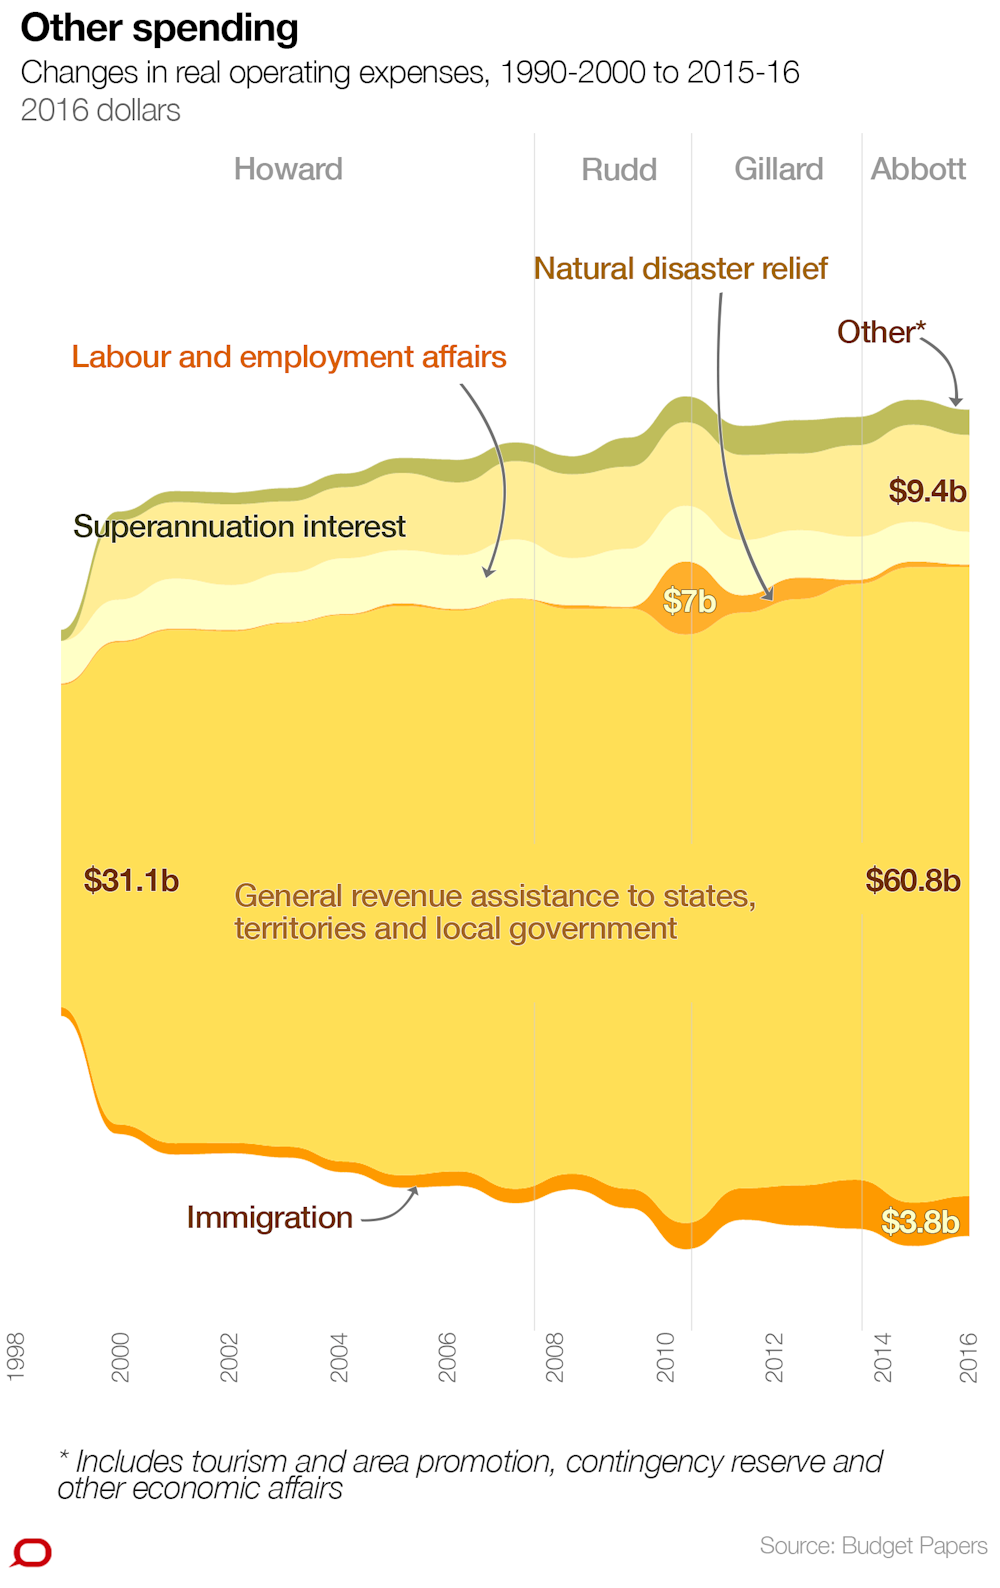
In the graph below “other” spending includes the distribution of GST revenues to states and territories as well as spending in areas such as job seekers assistance, industrial relations, vocational training, tourism and immigration. This constitutes the second highest share of government spending, at 18% (A$83.4 billion) of the total spend. General revenue assistance to states and territories accounts for two thirds of spending in this category.
Governments spend almost as much on defence and public safety (around A$32.6 billion) as they do on education (A$34.3 billion), although the states ultimately pick up most of the education bill.
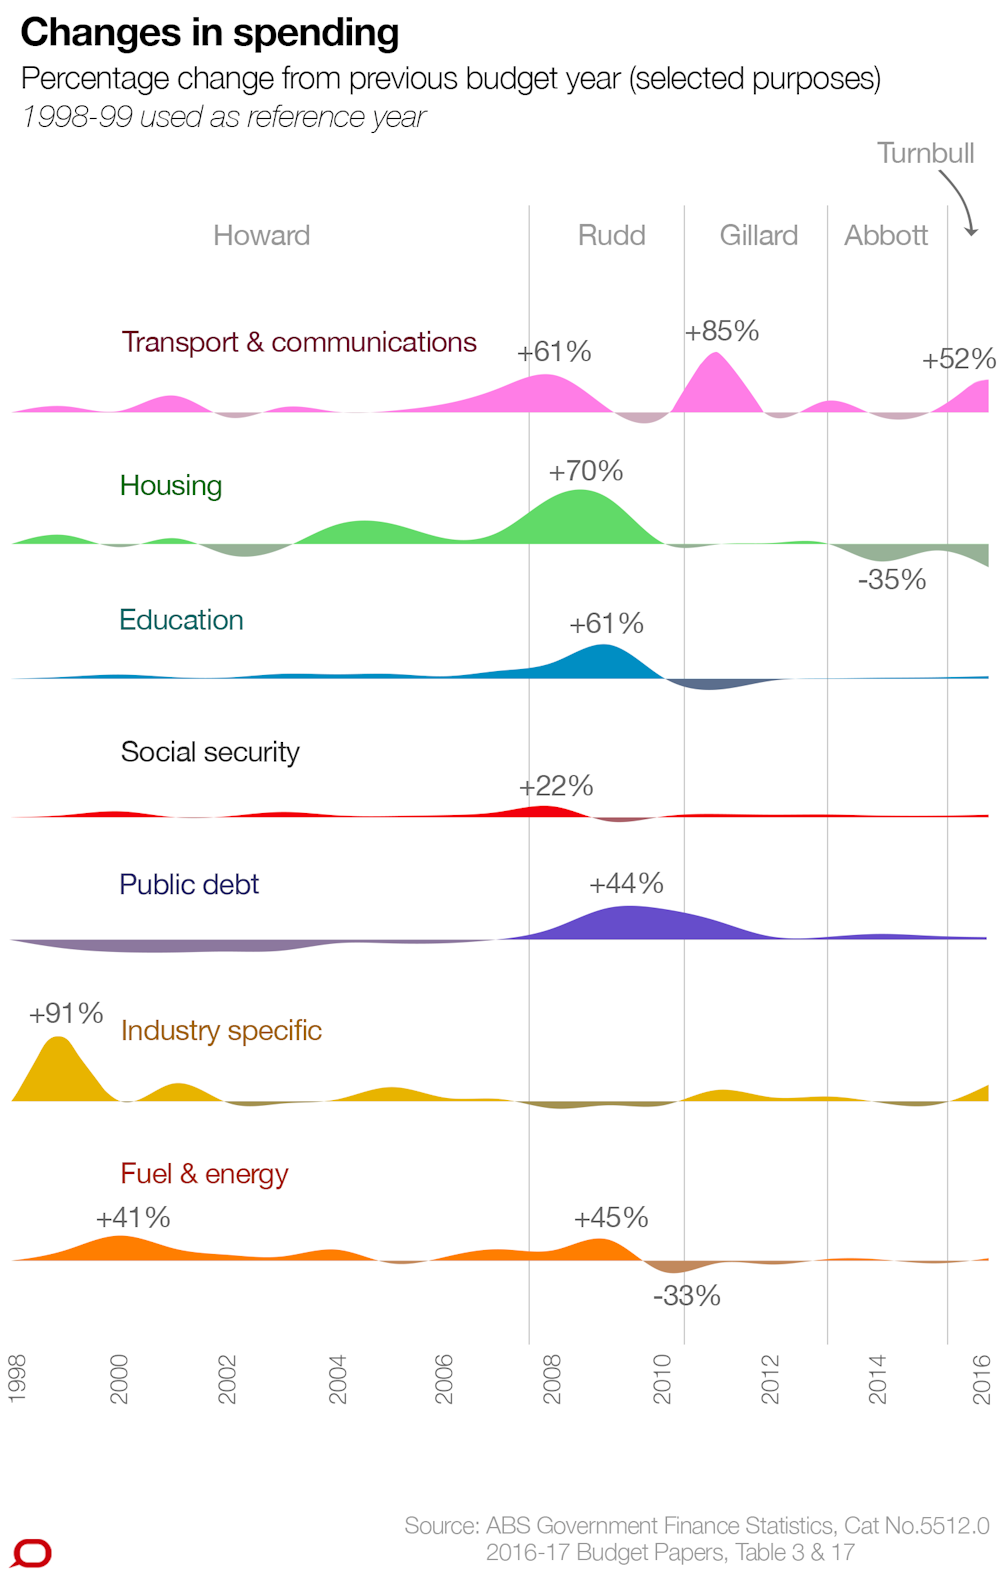
The global financial crisis saw a temporary blip in the mix of general government spending. Social security spending rose by 22% in the year to June 2009, and education expenditure jumped 60% a year later as a result of Rudd’s economic stimulus package.
Government spending on public debt interest has more than tripled in real terms to A$15.4 billion since the start of the global financial crisis, and now accounts for 3.7% of all government spending.
Many of the changes in real government spending between 2008 and 2010 were driven by the impact of the global financial crisis, which resulted in a slowdown in economic growth, rising unemployment and a negative hit on the sharemarket.
The Rudd government response was a stimulus package. The main spending increases came from a combination of accelerating public debt interest, increased payments to assist the unemployed, but mainly the government’s stimulus measures channelled through increased spending on education, housing and cash payments to families.
If a spending measure is truly temporary, a rise in real spending should be followed by an equivalent fall in subsequent years when the spending runs out or the program ends. This is evident to some degree for the social security and welfare and fuel and energy portfolios, but less so in other areas.
For example, the 45% rise in fuel and energy spending in 2008-09 was primarily driven by the introduction of the Energy Efficient Homes package within the Rudd stimulus suite. The scheme ended in February 2010, resulting in a 33% drop in spending.
On the other hand, spending on education rose by A$16 billion as part of the Rudd stimulus package, but remained A$10 billion higher than pre-global financial crisis levels in subsequent years.
Overall government spending has continued to grow since 2010-11, but less dramatically than during the heart of the global financial crisis, by around 8% in real terms over the five years to 2015-16.
Social security and welfare spending constitutes the largest spending commitment of any government budget. It has risen by 70% in real terms over the past fifteen years, from A$91 billion at the turn of the millennium in 1999-00 to A$155 billion in 2015-16.
The biggest welfare spending is for assistance to the aged, families with children and people with a disability. Together, these three items make up almost 85% of all welfare spending.
The 2008-09 Rudd stimulus package had a substantial yet temporary effect on welfare spend, with “bonus” cash payments to families in the 2009 calendar year increasing assistance to families by around A$10 billion. Additional cash payments were also made to students, pensioners and farmers under the stimulus program. And 8.7 million Australian workers earning $100,000 or less also received a cash payment.
Australia’s ageing population and increases in both disability prevalence and disability support are the main driving forces behind welfare spending growth. These factors will continue to exert pressure on future government budgets, especially with the full rollout of the National Disability Insurance Scheme (NDIS).
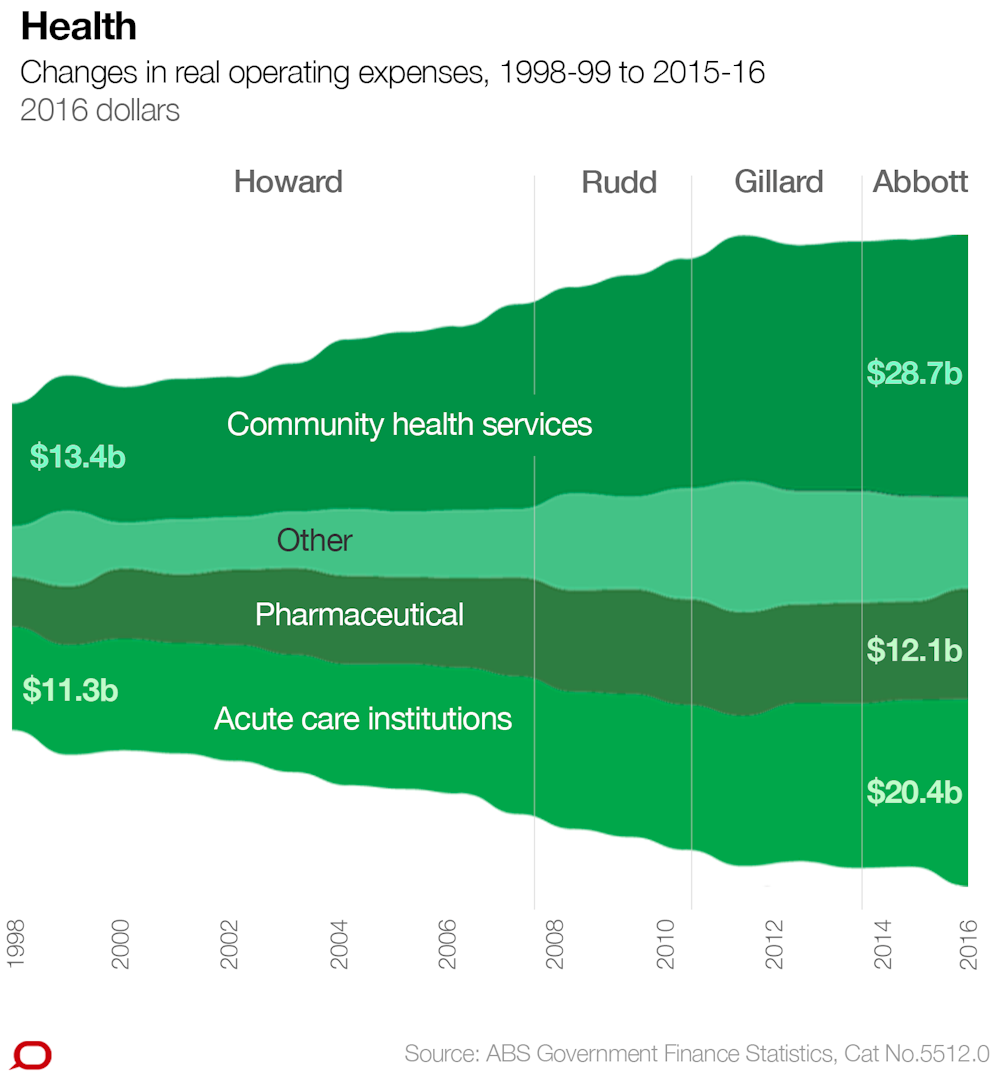
More than 40% of the government’s 2015-16 health budget of around A$71.2 billion was committed to community health services spending. At A$28.7 billion, spending in this sector has nearly doubled since the start of the millennium and by a quarter since the start of the global financial crisis in 2008-09.
This stems from the need to deliver medical services to a growing – and ageing – population, and the increased prevalence of chronic disease. In this respect, Australia is little different to most countries around the world.
Specific measures contributing to this growth included the expansion of health infrastructure, the costs of enhanced primary care attracting higher Medicare rebates, and indexation of health related payments to states and territories. Pharmaceutical spending increased by 12%, from A$1.4 billion year-on-year to A$12.1 billion in 2015-16.
Education spending rose dramatically during the global financial crisis, with spending on primary and secondary education increasing 81% to A$24.7 billion in the year to 2009-10 as part of the economic stimulus package.
Rudd’s “education revolution” led to a 12% growth in education spending in the 2008-09 budget, quickly followed by a further 61% spending increase in 2009-10 as part of the economic stimulus package. Spending in the following year fell as the temporary stimulus measures came to an end, but overall, education spending has remained significantly higher in real terms than pre-global financial crisis levels.
Spending on the university sector rose to around A$10.9 billion over the same period, but has remained relatively stable since.

Federal government money given to the states and territories
The federal government committed A$60.8 billion in general revenue assistance to states and territories in 2015-16, almost all of which came through the distribution of GST revenue. General revenue assistance spending rose A$3.8 billion in real terms in 2014-15, up 7% on the previous year, but has since stabilised.
Spending on superannuation interest has grown by a quarter since the end of the Howard years, reflecting the increase in the government’s superannuation liability. Lower public sector wages and employment have led to superannuation interest payments stabilising over the last two budgets to around A$9.4 billion in 2015-16.
Immigration spending rose between the Gillard and Abbott governments to a peak of A$4.7 billion in 2013-14, but has since fallen back to around A$3.8billion in 2016 dollars.
Much of the growth in immigration spending occurred during the Rudd and Gillard governments, by an average of 23% annually. This compares to an average of 7% during the previous Howard years. Additional government spending on detention facilities for irregular arrivals was the principal reason for this spending growth.
Natural disaster relief spending spiked between 2009 and 20-11 to assist with the damage and recovery costs from the Black Saturday bushfires in Victoria in 2009, and the 2010 Queensland floods.
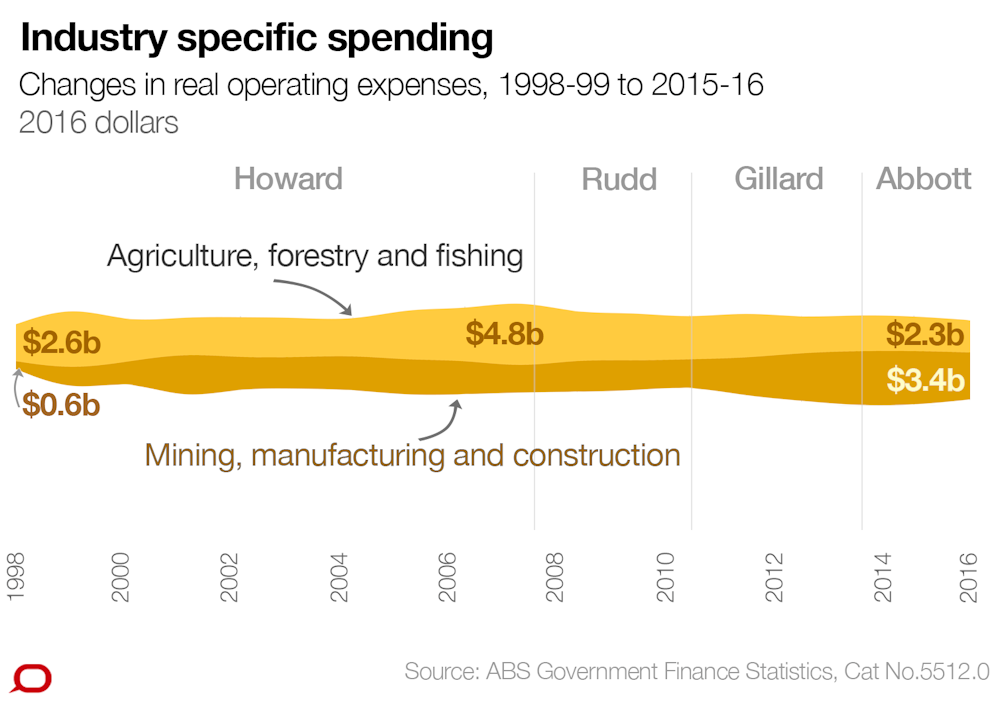
Government approaches to supporting various industries has typically been applied on an ad hoc basis. Budget spending on specific industries has risen from A$3.2 to A$5.6 billion in real terms. Agriculture, forestry and fishing typically received a greater share of industry spending during the Howard budgets, reaching a high of A$4.8 billion in Swan’s final 2007-08 budget.
Growth in industry spend slowed during the Rudd years, picking up again with the Gillard and Abbott governments, with a greater preference towards spending in mining, manufacturing and construction projects.
Spending on housing and community amenities has increased from A$2.7 billion to A$7.6 billion, reaching a high of almost A$12 billion in the Rudd years. Spending in this portfolio increased with the Rudd stimulus package, incorporating a number of housing affordability measures including the First Home Buyers Grant Scheme and a boost in investment in social housing.
Spending on sanitation and protection of the environment also expanded rapidly during the Rudd/Gillard government, relative to the Howard years. The establishment of the Climate Change Action fund introduced by Rudd in 2009-10 and the Clean Energy Futures package in 2010-11 have been the main drivers behind this increase. Spending in each has been pared back since the Liberals came to power with Abbott at the helm.

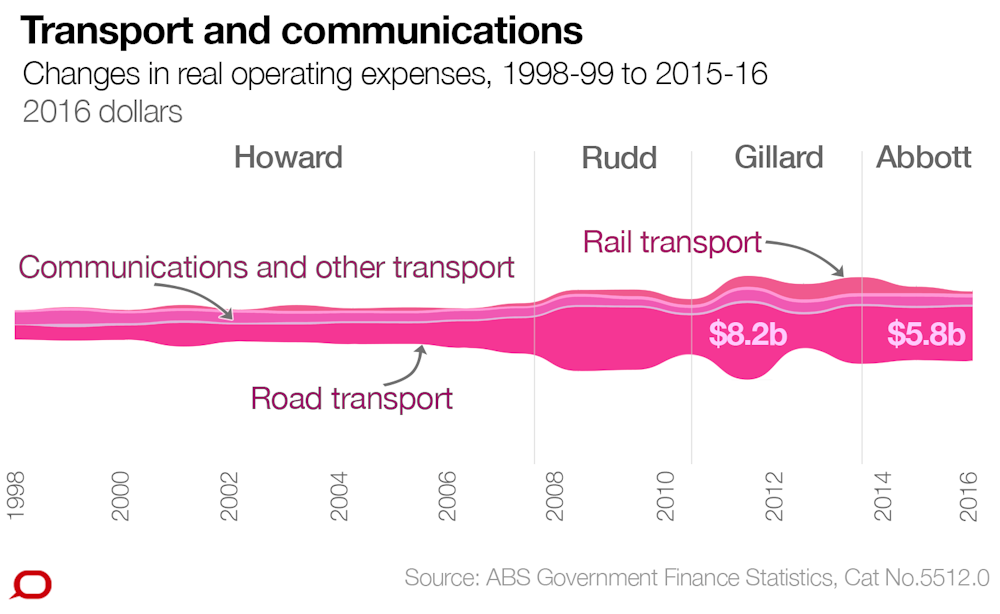
Commonwealth spending on transport and communications projects has more than doubled from A$3.1 to A$7.5 billion over the last 15 years. Spending remained relatively stable under Howard’s government, and then got a further injection on roads in the last two Swan budgets. The Rudd government continued this trend, with Gillard following suit with increases in both road and rail projects.
Spending in this portfolio has been clawed back since the Abbott government, falling from A$9.2 billion to A$7.8 billion between the final Labor government budget (2013-14 financial year) and the first Liberal government budget (2014-15 financial year). The most recent Turnbull/Morrison budget has reaffirmed spending commitments under this portfolio, committing to more than A$11 billion in 2016-17.
The Howard/Costello years were characterised by good economic times, with an extended period of strong revenue growth, yet this prosperity wasn’t matched with any significant spending growth. In fact, overall government spending fell as a share of GDP – from 25.7% in 2000 to 23.6% in 2006-07 – the lowest share since the start of the millennium. And the combination of strong revenue and limited spending commitments under Howard drove down public debt, and public debt interest payments.
We saw some pretty dramatic increases in real spending when Rudd came into power in December 2007. Rudd’s first budget in 2008-09 saw some substantial spending commitments in the area of education but nothing exorbitant.
However, the major turning point in government spending has been driven by the response to the global financial crisis. There were significant spending commitments over the course of the crisis, some of which are still present.
Spending on public debt interest has increased to A$15.4 billion since the global financial crisis - more than the spending on transport and housing combined. And it’s projected to increase further to A$18.7 billion by 2019-20. This just emphasises how high the stakes are for Scott Morrison in delivering a credible budget repair strategy.
The spending of incumbent governments inevitably draw from the commitments of previous administrations, especially for those programs – in infrastructure, education or housing - that involve medium-term funding commitments.
The growth in real spending in areas that directly affect households – social security, NDIS, health or pensions - is an issue that no government can ignore. NDIS costs have been hugely underestimated already, and social security and health spending will inevitably increase with the ageing population.
Set against this context, it’s clear that a piecemeal approach to budget repair is unsustainable. A drop in revenue has ramped up budget pressures, and highlights the compelling need to return to a sustainable spending path and a credible budget repair strategy.
The Turnbull government cannot shy away from making the big decisions that secure a sustainable future for Australia. And the roadmap towards a sustainable future has to include revenue as well as spending as part of the recovery narrative.
The graphs in this article were created by The Conversation’s Multimedia Editor Emil Jerayatnam