A simple line graph of the share of mining investment in Australia’s GDP reveals the scale of what our economy is going through.
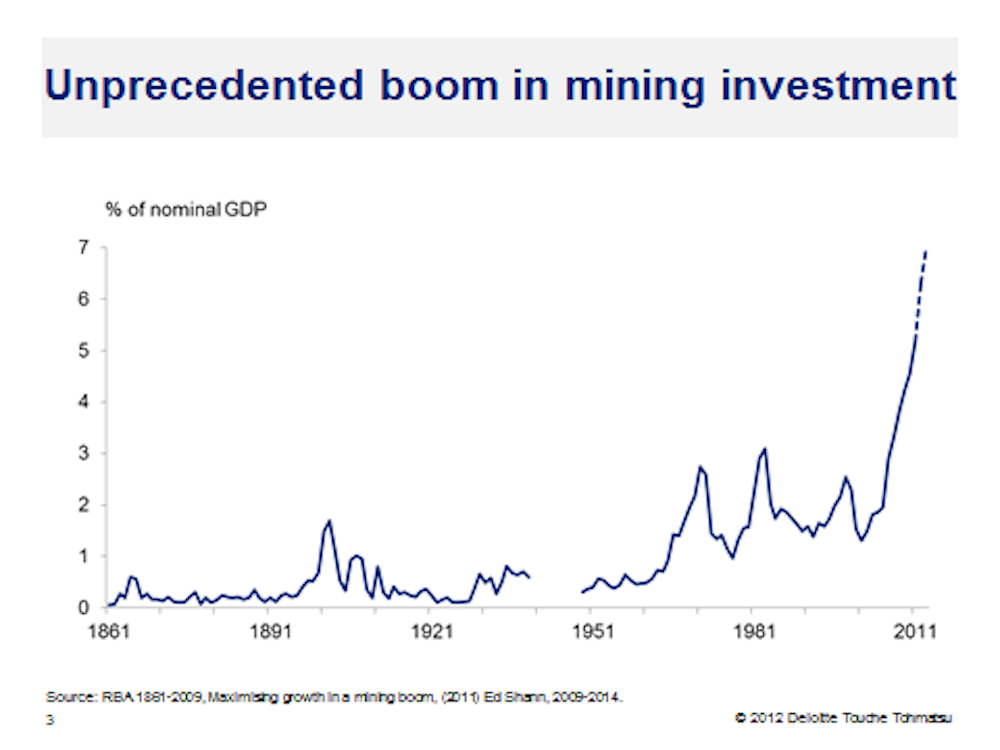
It shows that mining investment is now twice as large relative to GDP as it has ever been, and is forecast to reach at least three times its previous peak in the early 1980s over the next five years.
It is impossible to avoid investment on this scale distorting the overall pattern of economic activity. We have a raging case of “Dutch Disease” or more accurately a “booming sector problem” of unprecedented proportions.
Run-away growth in one sector would create tension enough without the added dimension of geographic dispersion. Essentially the boom in mining activity is occurring north-west of a line drawn from Brisbane to Adelaide. Coincidentally (perhaps not?) this also marks off an area where a minority of Australians live and work.
At best, mining and mining-related activities account for around 20% of aggregate economic activity in Australia. The remaining 80% employs the lion’s share of Australian workers in industries and occupations located overwhelmingly in the south-east of the continent.
Yet the 20% of national economic activity driven by mining and its related industries is growing faster than the Chinese economy—around 8.5% per annum on current estimates — while the remainder is growing at 2% per annum or less.
The economy at large is growing at its trend rate of around 3.25% per annum (or perhaps a bit faster given last week’s national accounts figures) yet the sectoral and geographic composition of this growth is disparate and increasingly so.
In aggregate terms, the Australian economy is in rude health. Not only is aggregate economic growth at trend but unemployment is essentially at its full employment or “natural” level of 5% of the labour force, and average CPI inflation is tracking around the mid-point of the Reserve Bank’s target range of 2-3% per annum.
No wonder Treasurer Wayne Swan and Reserve Bank Governor Glenn Stevens puzzle over the downbeat commentary they read in newspapers and the downcast faces they encounter among members of the public.
How can such stellar economic performance elicit only scowls and grumbles of discontent? Why do foreigners marvel at the rise and rise of the Lucky Country while its denizens cower in fear of imminent economic disaster?
The answer lies in the scale of the economic transformation and its unique conjunction of sectoral and geographic dispersion. Most Australians have little direct or even indirect experience of the growth being generated by the mining boom. It seems remote and, indeed, touches comparatively few people in their everyday lives.
On the contrary, for most Australians, living in the south-east and working in non-mining-related industries, the talk at work is of lay-offs, redundancies and closures. Shop windows advertise a seemingly endless stream of “pre-season”, “mid-season” and “end of season” sales with massive discounts to listed prices. And this is before the nightly dose of fear-mongering on the European financial crisis and the all-too-evident woes of the stock market are added to the mix.
It’s hard to keep your head when all about you are losing theirs – but neither are people’s fears completely groundless. The rapid growth of mining and its related industries drags resources from other less-productive parts of the economy, and attracts foreign investors whose purchases bid up the value of the Australian dollar.
Both of these forces sift the non-mining sectors of the economy to isolate those whose productivity can justify retaining their place in the economic firmament.
Businesses and even whole industries that fail this test will yield up their capital and labour to the expanding sector. While reallocating the economy’s resources is not without pain, neither is it without gain.
Indeed, the whole transformation raises Australian living standards, as did the resource reallocation that followed the tariff reform, privatisation and deregulation of the 1980s.
The Australian economy is being transformed by the historic emergence of China and India, and to a lesser extent Russia and Brazil, from the global economic background to the foreground. This process will not be short-lived and so there is little point in mothballing our industrial structure until the wave passes.
But there is a clear need to explain the process to those who find it hard to see the wood for the trees. Paul Keating captured the 1980s transformation in a brilliant riposte about the risk of Australia becoming a “banana republic”. We need another catch-phrase to focus our minds on the opportunities before us rather than the threats.

projectcoach
logged in via Twitter
Good article. Lets coach people to fit into the new paradigm to achieve the benefits quickly for all Australians
Gavin Moodie
Principal Policy Adviser
Stephens also pointed to consumers cutting their debt, probably by paying off their mortgages, probably due to residential property prices falling. Both the fall in consumer debt and the fall in residential property prices are good, but they reduce consumer spending and both reflect and accentuate pessimistic sentiment.
Tim Hawes
Mr.
Short term pain for long term gain?
We now have a savings rate of 10.4% ( http://www.bankingday.com/nl06_news_selected.php?selkey=12684 ). Surely now we have learned from the US that debt based consumption is not the path to long term prosperity.
There might be a silver lining to this pessimism.
Ian Harper
Professor Emeritus at University of Melbourne
There are clearly benefits to households "repairing" their balance sheets but stimulating current consumption is not one of them! Indeed, the whole point of repairing a balance sheet is to shore up future consumption possibilities against contingencies like a spell of unemployment. But, yes, the resulting impact on house prices reinforces the sense that we are in for a rough trot. It's a vicious circle: people repay their housing loans faster in order to prevent their net worth from falling faster as house prices fall; and yet the resulting reduced outlays on housing causes a further round of house price reductions. The fear of this spiralling out of control is another factor weighing on people's minds.
Peter Ormonde
Peter Ormonde is a Friend of The Conversation.
Farmer
Good piece.
I suspect there are several reasons for this undue pessimism in the land of She'll be Right.
The first is that people in the South East in the main don't see what is actually happening... that the boom is happening elsewhere. One exception is my neighbourhood in the Hunter Valley where I am surrounded by open cut coal mines, huge trains hauling coal down to the world's largest coal export port and the worst traffic jams imaginable as tens of thousands of cars, trucks and utes clog…
Read moreSeán McNally
Market and Social Researcher
Ian, nicely explained. there are many people I know in the mining areas whose greatest complaint is the difficulty of getting and keeping staff in realtively low paying jobs when they can earn more more in mining and supplying industries. While those in in the S.E it is more about keeping your own job.
What is also interesting is how the mining boom has warped a lot of discussions and debates that are even far removed from their effects.
Ian Harper
Professor Emeritus at University of Melbourne
Thanks Sean. Yes, the distorting effects of the two-speed economy can be observed at various levels - like a set of Russian dolls! Within the mining towns themselves, high wages paid by the mining companies bid up food and accommodation prices, in some cases beyond the reach of community workers whose wages are tied to standards set in non-mining occupations.
George Naumovski
Online Political Activist
To take full advantage of our mining boom, the RSPT should have been implemented when first introduced but also should have been implemented from mining boom 1 during the Howard years.
As with corporations hugely profiting as they are, as they off shore, outsource and import cheap labour hire, it leaves the majority not in the “booming” as the cost of living rises and wages get lowered and people are just living off credit upon credit until they have to pay for it which will be with credit.
Lincoln Fung
Economist
It seems that economist should use a realistic and dynamic CGE or CDE model to study different scenarios and come up with the best policy recommendations for how to manage this reasonably long mining boom and its effects on other sectors as well as regional implications of population location and planning.
Dale Bloom
Analyst
The mining boom may have reached a plateau or peaked, with companies such as BHP Biliton and Rio Tinto pulling out of the Abbot Point coal terminal expansion.
Regardless, it is now time to capitalise as much as possible on the mining boom. Increasing taxes on mining companies will not necessarily help Australia much. The money simply goes to state and federal governments who often show extraordinary talent and incredible skill in wasting billions of dollars of taxpayer funding. The Gillard government and the Bligh government are fine examples.
Instead, it is time to start convincing mining companies and mining magnates to be investing in other industries in Australia.
That could be a win-win situation if mining does begin to slide.
Optimistic Alex
Garbologist
People are pessimistic because they have reason to be. Economic growth only benefits those who have a significant share in the economy. The rich get richer and the poor stay poor - that's what any rational person would concluding when looking at the real wages of the poorest 30% of Australians over the last few decades.
We are also accumulating massive ecological debt. While the economy grows we continue to accumulate greenhouse gases in the atmosphere, our soils degrade, the pacific garbage patch gets larger and the Murray Darling continues to turn into a salt plain. What's the point to economic growth if it results in permanent ecological destruction? We are living well at the expense of all future people.
If you want to make people optimistic you need to make meaningful, material changes to their lives. The mining boom hasn't done that.
Peter Ormonde
Peter Ormonde is a Friend of The Conversation.
Farmer
Not actually the case Optimistic Alex...so cheer up. It depends a bit how one measures income and "living standards" but there is a significant and substantial transfer of income occurring beyond simple hourly wage levels.
The best indication comes from the Human Development Index analysis undertaken by the UN. You can find it here:http://en.wikipedia.org/wiki/Human_Development_Index
Now that's OK you say - but that's just averages isn't it ... the poor still get poorer and the rich just…
Read moreOptimistic Alex
Garbologist
Hi Peter,
Since you brought up Gini co-efficients - you'll no doubt be aware that Australia's Gini co-efficient has steady been increasing since the mid 90s "Gini coefficient in Australia was 0.307 in 1995-96 whereas in 2007-08 it has risen to 0.345" (here: http://bilbo.economicoutlook.net/blog/?p=4447). I'd be interested to know if you have data to prove things have changed.
Also, you missed my point about ecological debt. That's the important bit.
Peter Ormonde
Peter Ormonde is a Friend of The Conversation.
Farmer
Couldn't agree more re the notion of "living standards" that sees us reduce the place to a tip... it's why I always put it in quotes... seems to be more an index of consumption and waste than of real quality of life.
I am far more inclined towards the human happiness index than any measure of our capacity to buy stuff we don't need from harvey norman and throw out the stuff we bought last year.
I did read some detailed analysis of household incomes somewhere more recent that the GINI stuff - can't find it - will track it down - meanwhile try this:
http://www.abs.gov.au/ausstats/abs@.nsf/Latestproducts/6523.0Media%20Release12009-10?opendocument&tabname=Summary&prodno=6523.0&issue=2009-10&num=&view=
Gavin Moodie
Principal Policy Adviser
Thanx for the link Peter. I've been casting around in a desultory way for a while trying to get Australian income distributions to counter the 'I'm on only $150k and I'm poor' brigade. Unfortunately the ABS data you linked are for households only. I'd be interested in individuals' income distribution. The Australian Tax Office surely publishes tables, but I haven't found them yet.
Peter Ormonde
Peter Ormonde is a Friend of The Conversation.
Farmer
Here's a bit more but still not the stuff I can recall reading ... curse this creaking memory ...
http://www.abs.gov.au/ausstats/abs@.nsf/Lookup/by%20Subject/1370.0~2010~Chapter~Household%20income%20%285.3.2%29
Peter Ormonde
Peter Ormonde is a Friend of The Conversation.
Farmer
Aha ... found it!
http://www.abs.gov.au/ausstats/abs@.nsf/Lookup/by%20Subject/1301.0~2012~Main%20Features~Household%20income,%20expenditure%20and%20wealth~193
Gary Murphy
Independent Thinker
I would be interested in finding out what the median income is (as opposed to the average income - which I suspect is quite skewed)
We always seem to hear about average income and if this figure is skewed, it could be creating unrealistic expectations about wages.
Peter Ormonde
Peter Ormonde is a Friend of The Conversation.
Farmer
The numbers in that latest ABS link I put in here had some indication of ranges of income per household - deciles I think.
I'm trying to track down some stuff on individual income (as per Gavin's request above) but to be honest I suspect that's very thin on the ground... ABS concentrates - I suspect exclusively - on households.
If I find some I'll post it here in the next day or so - depends on how much rain we get.
Gary Murphy
Independent Thinker
I suspected as much.
Found this article from about a month ago:
http://www.abc.net.au/unleashed/2614076.html
Uses statistics from the ATO
Gavin Moodie
Principal Policy Adviser
Great, thanx.
I read the ATO table to say that in 2008-09 an annual taxable income of $135,994 to $153,149 was in the 84.4 percentile, ie, the top 15.6%. But Matt Cowgill wrote 'Mr Gray, the man in the Daily Telegraph’s story, earns $150,000, which would put him in the top 3 per cent of taxpayers by income (or at least it would’ve in 08-09).' So maybe I'm reading it wrongly.
Gary Murphy
Independent Thinker
I'm looking at the Excel spreadsheet (Personal Tax Table 9) and it shows (column G) that 97% of Taxable Incomes were below 150K.
Gavin Moodie
Principal Policy Adviser
Thanx. I was looking at column K - taxable income (excluding losses).
Andrew Huntley
Power Systems Consultant
Interesting link, Peter.
It doesn't really provide much ammunition to denounce the "I make $150k per year and I don't feel rich" crowd, as they have been described above.
Far from it... my reading shows me that the equivilised after taxes household income of $ 848 ..... means that a single income family with 3 kids (lets assume 2 of them are late teenagers, thus counting as adults for the purpose of calculating equivalent living expenses.....
....this household , in order to achieve the average living standard, would require 1+0.5+0.5+0.5+0.3 = 2.8 times the equivilised single rate, or $2,374 per week after tax.
You can assume an average payg taxation rate around 25 cents in the doll
Andrew Huntley
Power Systems Consultant
...sorry, inadvertently hit "reply" (stupid phone).
As i was saying, 25 cents in the dollar, so in order to achieve the average australian disposable income, our hypothetical family's breadwinner would have to earn a salary of $2,374 x 1.33 x 52 weeks in the year ....
= $164,593 per year.
That's right, if our hypothetical family earned $150k, far from being "rich", they would in fact have a lower equivilisdd household income than average.
Makes you think, doesn,t it?
Gary Murphy
Independent Thinker
I suspect you are comparing average household income with your hypothical families individual income divided three ways - but I can't be bothered wading through it all and working out what 'equivalised' means.
Basically, 150K works out to about $75 an hour. That seems like a pretty good wage to me (I certainly don't know anyone that earns that much) especially when you compare it to the minimum wage (which I think is about $16 an hour).
Andrew Huntley
Power Systems Consultant
Hi Gary,
If you read the link provied by Peter Ormonde, It explains "equivilised".
The short version is that the equivilised wage is what a 1person household has to earn in order to have the average australian standard of living. In multi person households, additional adults increase living costs by 0.5 times the equivilised average, young kids by 0.3.
Remember that the average Australian full time working week is now closer to 50 hours than 40. Then allow that many households earning $150 k p.a. will be doing so on 2 incomes. This actually translates to $28.85 per hour. Which is not really all that exciting.
Gary Murphy
Independent Thinker
I see.
Still, $2160 after tax per week for a family - I reckon I could live on that (dreamin').