
Think back to high-school science. Do you remember what the value of acceleration due to gravity at the Earth’s surface - denoted as “g” in textbooks - is?
For those whose memories may need a bit of prodding, it is normally given as 9.81ms2 - very simplistically, this means for each second a dropped object falls towards the ground, it accelerates at 9.81 metres per second.
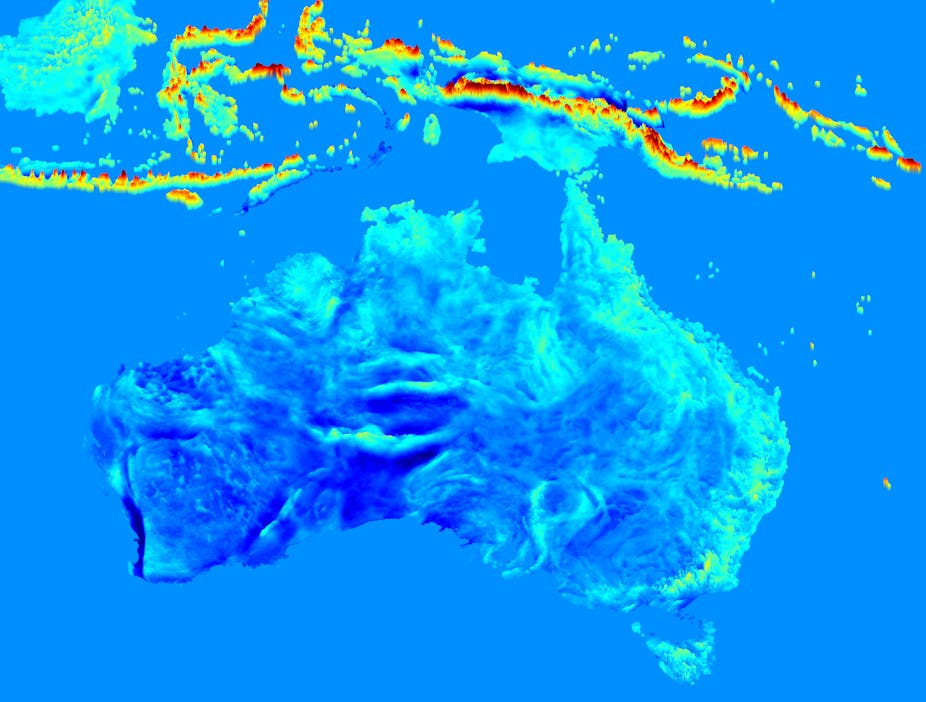
But this value of 9.81ms2 isn’t uniform across the surface of the Earth. In fact, in research recently published in Geophysical Research Letters, colleagues in Australia and Germany and I showed it varies from around 9.764ms2 in the Andes region to 9.834ms2 near the North pole.
The gravitational strength varies because Earth is not a perfect sphere of homogenous (uniform) mass density.
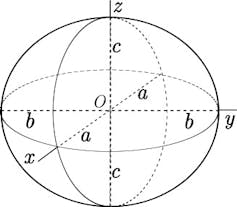
Our planet is much better represented through an ellipsoid, and the flattening (the poles are about 20km closer to the centre of Earth than the equator) causes gravity to increase towards the poles, while decreasing towards the equator.
Further important sources of variation are local or regional mass-anomalies, such as visible mountains, subterranean saltdomes, water masses, which all cause local variations in gravity.
To create high-resolution gravity maps, our research team calculated free-fall gravity at three billion points across Earth – that’s one every 200m.
Pinpointing the extremes
Overall, the regions of the extreme points (maximum near the North Pole, minimum near the equator) are not surprising because the dominant portion of gravity variations reflects the ellipsoidal shape of our planet.
In case of the maximum gravity acceleration, we suspected it would be the Arctic rather than the Antarctic, because gravity decreases with height, so is expected to be smaller in the elevated Antarctic terrain than at the Arctic sea level.
In case of the minimum gravity acceleration, it was clear that promising candidate locations must be:
- near or the equator
- at the summit of a mountain, with the location also being dependent on gravity anomalies in the interior of Earth
We expected one of the Andean mountains as a candidate, but the gravity minimum point turned out to be Peruvian mountain Nevado Huascarán which was a bit surprising because it is about 1,000km south of the equator.
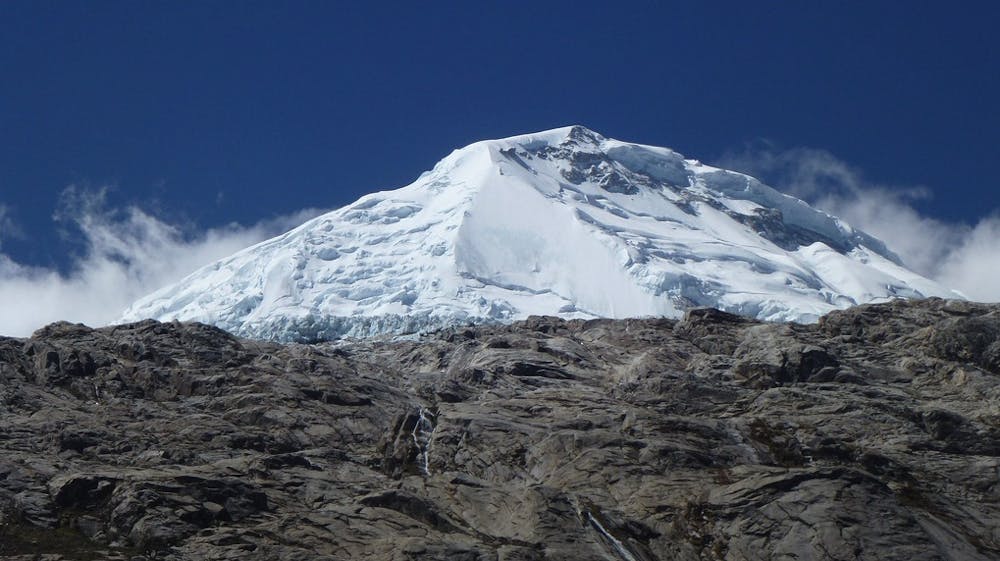
The increase in gravity away from the equator is more than compensated for by the effect of the mountain’s height and local anomalies.
Prediction tools
A fair portion of these variations can be estimated based on terrain model data, and this is what helped improve the resolution of our new gravity maps.
In 2012, we published high-resolution gravity maps for Mars and the Moon.
The high-resolution prediction techniques we used are not new and are often applied over industrialised regions by our fellow specialists and ourselves, but these methods were not yet extensively used at high resolution over other parts of Earth, such as African developing countries.
We simply applied the techniques everywhere on Earth with high-quality topography models available (roughly between 60º North and South latitude) to generate the new gravity maps.
Further to this, we incorporated newest gravity measurements by the European Space Agency’s Gravity Field and Steady-State Ocean Circulation Explorer (GOCE) satellite. These improve the coarse (regional-scale) features of our gravity maps.
Over some parts of Earth, such as Africa or South America, our work provides for the first time ultra-high-resolution estimates of free-fall gravity accelerations.

What are gravity maps used for?
High-resolution gravity maps are required in civil engineering, such as building channels, bridges and tunnels. They can also be used by surveyors and other spatial science professionals to precisely measure topographic heights with satellite systems such as the Global Positioning System (GPS).
Geophysical applications such as the exploration of valuable mineral resources also benefit from high-resolution gravity mapping.
Gravity maps are not used to calculate forces experienced by buildings and objects such as tunnels, bridges or pipes. Their usefulness is related to the measurement techniques used for setting out the coordinates of the objects.

Most measurement techniques (take spirit levelling as a classic example) depend on the gravity field (obvious through the spirit level).
In high-precision projects, the effect of the gravity field must be corrected for, otherwise the irregularities of the field can impact the survey and building process.
Our new gravity maps can be a convenient source to retrieve information on the irregularities of the gravity field.
A further increase in detail would be helpful particularly in mountainous terrain where the variations in gravity are generally stronger than in flat terrain (again, this is related to the gravitational attraction effect of the topographic masses).
New global elevation data sets (such as from the TerraSAR-X and TanDEM-X observation satellites currently orbiting Earth) could add further detail, and this would help reduce the mapping errors in mountainous terrain.