As an artist working across media, I’ve used everything from thread to my voice to poetically translate and express information. Recently, I’ve been working with another medium – geologic datasets.
While scientists use data visualization to show the results of a dataset in interesting and informative ways, my goal as an artist is a little different. In the studio, I treat geologic data as another material, using it to guide my interactions with Mylar film, knitting patterns or opera. Data, in my work, functions expressively and abstractly.
Two of my projects in particular, “points of rupture” and “tidal arias,” exemplify this way of working. In these pieces, my goal is to offer new ways for people to personally relate to the immense scale of geologic time.
Points of rupture
An early project in which I treated data as a medium was my letterpress print series “points of rupture.” In this series, I encoded data from cryoseismic, or ice quake, events to create knitting patterns.
Working with ice quake data was a continuation of my research into what I call “archived landscapes.” These are places that have had multiple distinct geologic identities over time, like mountains that were once sea reefs.
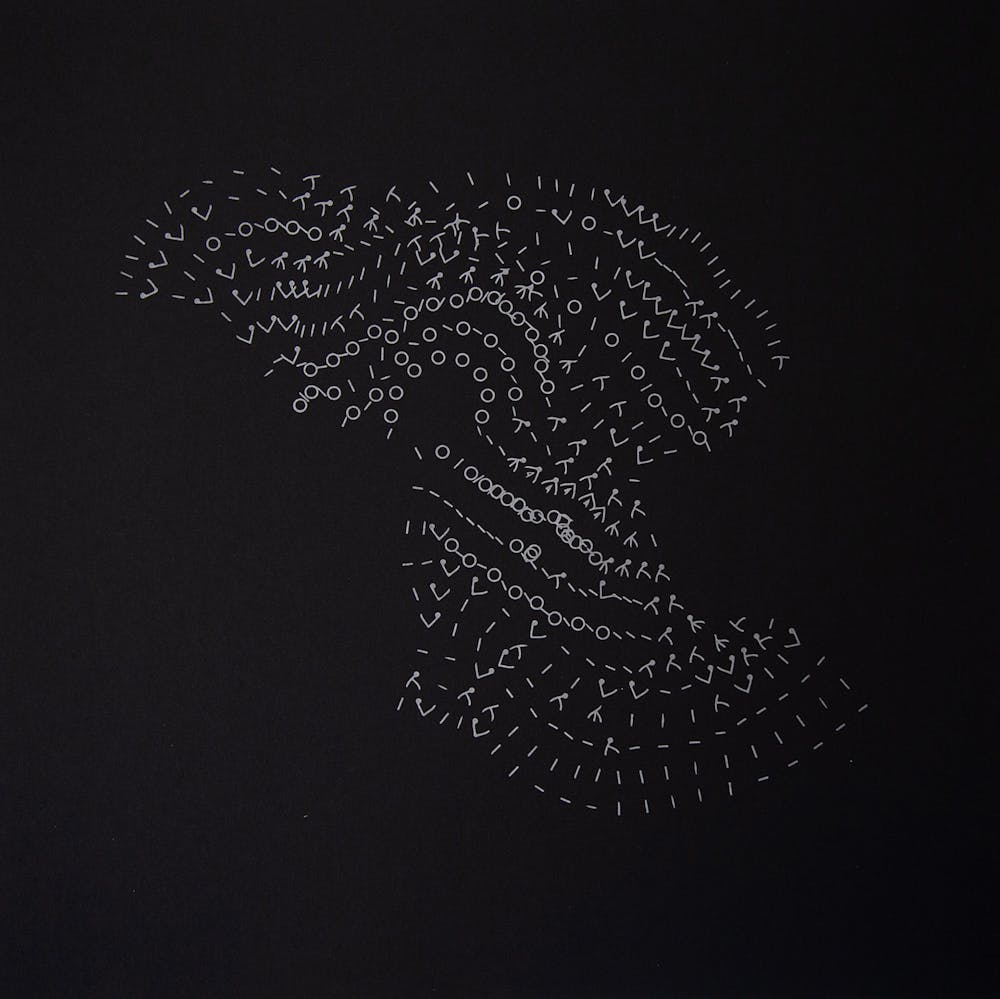
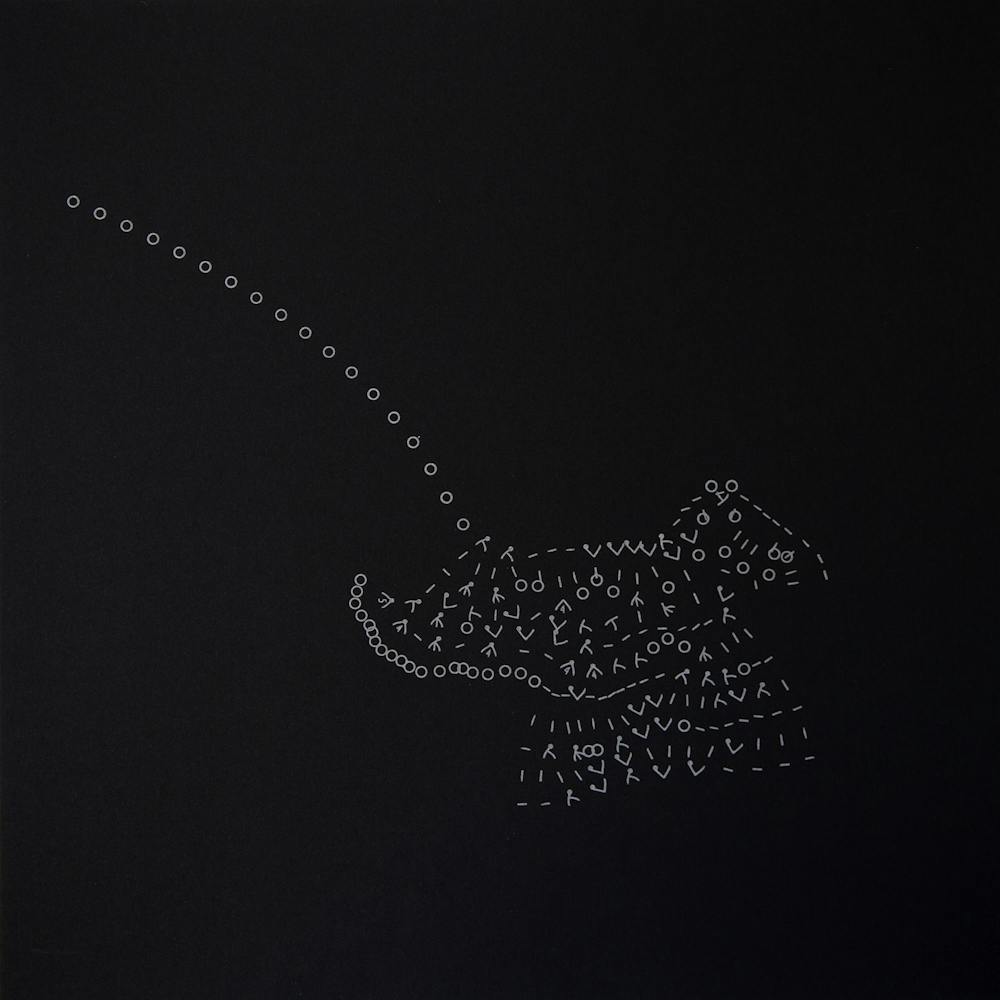
Because knit textiles are made up of many individual stitches, I can use them to encode discrete data points. In a knitting pattern, or chart, each kind of stitch is represented by a specific symbol. I used the open-source program Stitch Maps to write the patterns for this project, translating the peaks and valleys of seismographs into individual stitch symbols.
Knitting charts typically display these symbols in a grid. Instead, Stitch Maps allows them to fall as they would when knitted, so the chart mimics the shape of the final textile.
I was drawn to the expressive possibilities of this feature and how the software allowed me to experiment. I was able to write patterns that worked only in theory and not as physical, handmade structures. This gave me more freedom to design patterns that fully expressed the datasets without having to ensure their viability as textiles.
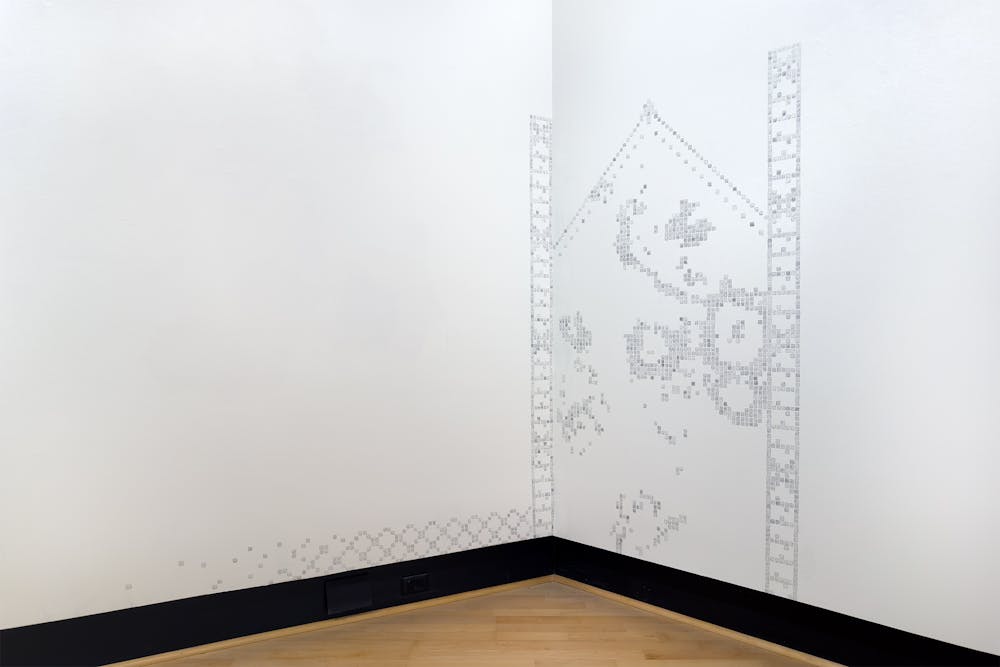
Glaciers form incrementally as new snowfall compacts previous layers of snow, crystallizing them into ice. A knitted fabric similarly accumulates in layers, as rows of interlocking loops. Each structure appears stable but could easily be dissolved.
Ice quakes occur in glaciers as a result of calving events or pooling meltwater. Like melting glaciers, knitting is always in danger of coming apart – but instead of melting, by snagging and unraveling into formlessness. These structural similarities between glaciers and knitting are reflected in the “points of rupture” prints, where disruptive ice quakes translate into unknittable patterns.
The loop
Repeated, interlocking loops are the base units that compose the structure of a knitted textile. The loop also forms the seed of an in-progress work I pursued during an artist residency with the NASA GEODES research group. I joined their research team in Flagstaff, Arizona, in August 2023. I assisted in gathering data from sites within the San Francisco volcanic field, while also conducting my own fieldwork: photography, drawing, note-taking and walking.
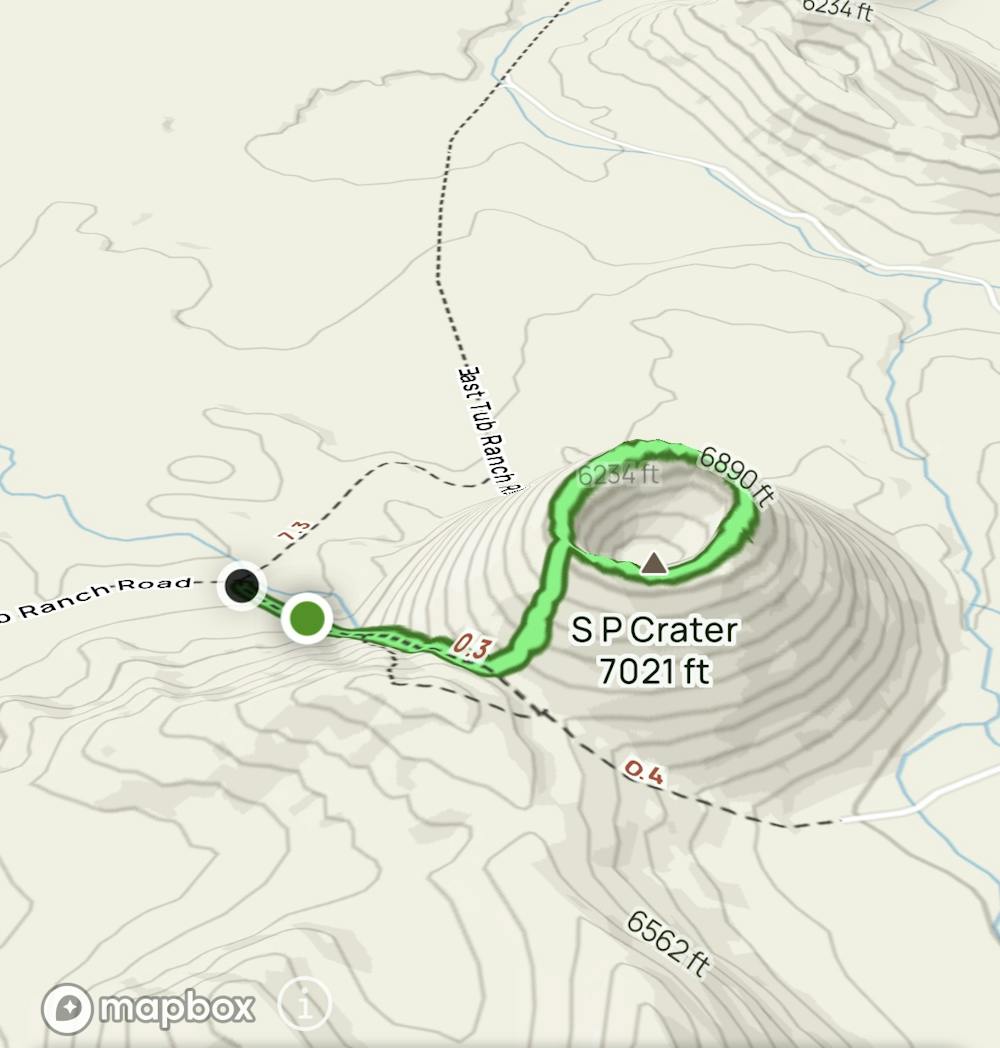
One of my walks was a trek around a particularly prominent geologic loop – the rim of the S P cinder cone volcano. This is the second crater walk I’ve completed, the first being a tracing of the subsurface rim of the Decorah impact structure in Iowa.
I see my paths through these landscapes as stand-ins for yarn. Over time, by taking walks that trace craters, or geologic loops, I will perform a textile. The performance of something as familiar as a textile offers me a new way to think about something that is much more difficult to comprehend – geologic time.
This article is part of Art & Science Collide, a series examining the intersections between art and science.
You may be interested in:
Literature inspired my medical career: Why the humanities are needed in health care
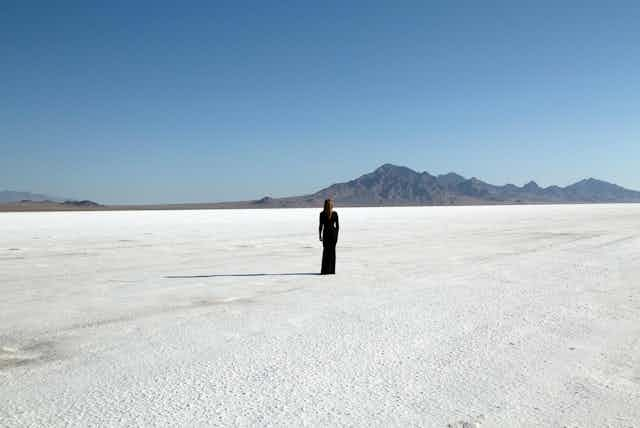
Performance and tides
Performance has been a useful tool in my work, as it can help people understand and relate to geologic processes.

The field of geology emerges from a long history of extraction and colonialist ventures. In this context, land is valued for its economic importance – as raw material to be extracted or territory to be claimed. In my performances, I aim to interact with geology as its own active entity, rather than as a consumable resource.
In recent years, I have composed and performed two arias from tidal data.
The first, “marseille tidal gauge aria,” sourced 130 years of sea level data collected from a tidal gauge in the Bay of Marseille, France. I converted each yearly average sea level into an individual note within my vocal range. This resulted in a composition that expresses the rising sea levels of the bay as increasingly higher pitches in the aria.
Its lyrics come from a somber poem in Rasu-Yong Tugen’s book “Songs From the Black Moon.” Each note of the aria communicates not just the measured sea level but also my emotive response to this dataset.

Last fall, “marseille tidal gauge aria” was transmitted to the ionosphere, the boundary between Earth’s atmosphere and outer space. This was done as part of artist Amanda Dawn Christie’s project “Ghosts in the Air Glow,” using the High-frequency Active Auroral Research Program’s ionospheric research instrument, which is an array of 180 antennas transmitting high-frequency radio waves.
The aria’s transmission reflected off the ionosphere, back to Earth and to shortwave radio listeners around the world.
For the second of these vocal pieces, “skagway tidal aria,” I used predictive as well as recorded tidal data from Skagway, Alaska. With this data, I composed an aria for The 2051 Munich Climate Conference, where speakers presented from the perspective of a climate-altered world 30 years in the future.
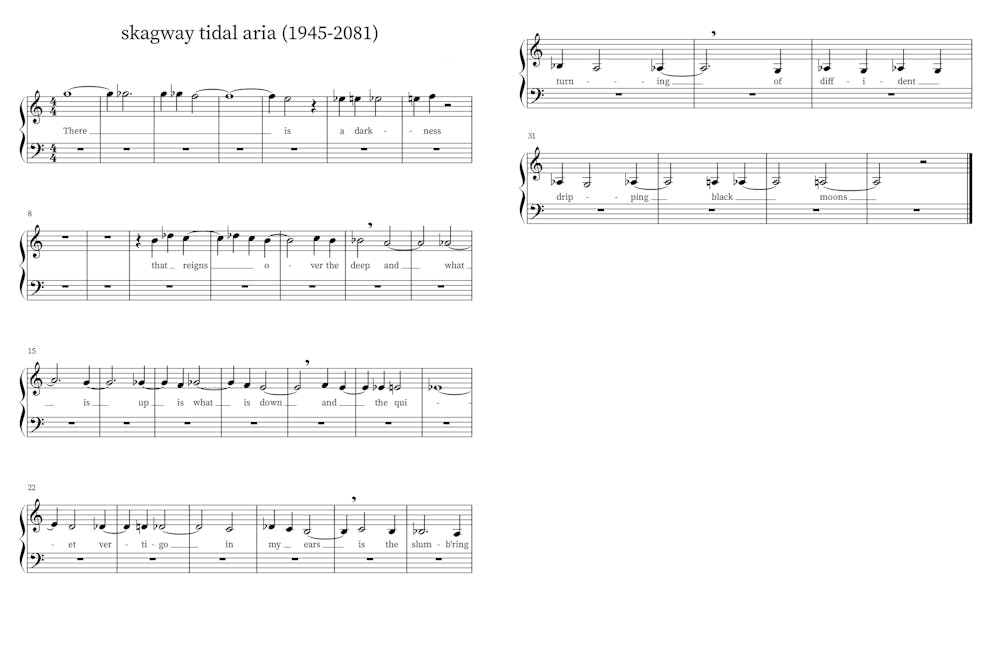
I was drawn to this particular dataset because the falling tide levels in Skagway appear to contradict the global trend of rising sea levels. However, this is a temporary effect caused by melting glaciers releasing pressure on the land, allowing it to rise faster than water levels. The effect will flatten over the next half-century, and Skagway’s tides will start to rise again.
Over the next few months, I’ll be working with geophysical datasets gathered during the NASA GEODES field expedition to write new arias. I want these pieces to continue blurring the separation between the human and the geologic, inviting listeners to think more deeply about their own relationships with the lands they use and occupy.