

As they reach the end of primary school, the UK’s children face persistent inequalities in their cognitive development. New findings from the Millennium Cohort Study (MCS), a survey of children born between 2000 and 2002 across the UK, show that the level of parents’ education and family income both remain clearly associated with children’s verbal skills at the age of 11 – even when taking into account other differences in family background.
The MCS, based at the UCL Institute of Education, London, has followed around 19,000 children since they were nine months old, visiting them and their families again at ages three, five and seven and then most recently at the age of 11.
On each occasion from age three onwards, tests of cognitive skills have been carried out by specially trained interviewers, including an assessment of verbal skills. These tests changed depending on how old the children were, allowing us to track how inequalities in verbal skills have persisted through their childhoods. At the age of 11, they were asked to say how three items went together: for example “they were all fruit” for “apple, orange, banana”.
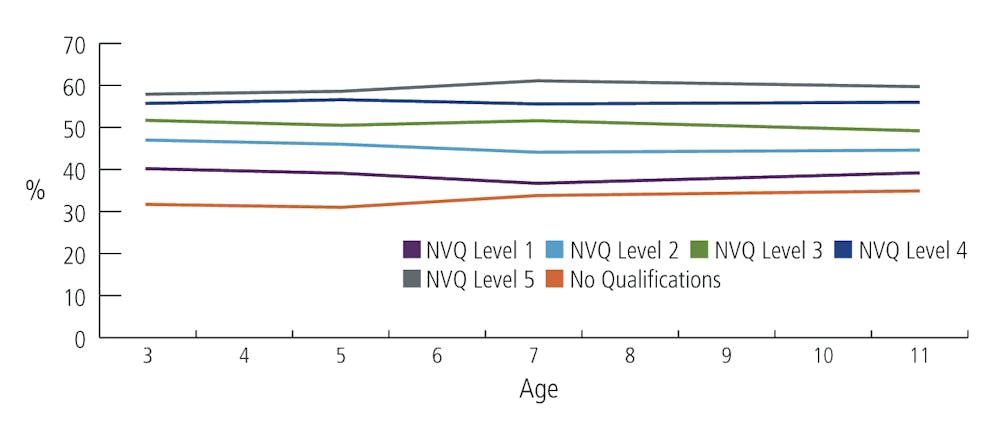
The first graph below illustrates the differences in average scores on these tests of children with parents with differing levels of qualifications – where NVQ 5 is the highest, and no qualifications the lowest. It shows how the gaps in average scores between children whose parents have a low level of education and those with a high level have remained relatively constant across their childhood.
Memory and decision making
At the age of 11 the children also undertook two assessments from the CANTAB suite of neuropsychological assessments. The first related to spatial working memory, assessing their errors in a memory game and their strategy and speed in completing the tasks. The second tested the quality of their decision making and their risk-taking.
Again, there were clear differences in children’s performance on these tasks, depending on the level of their parent’s education and family income, even when accounting for other aspects of family background. In particular, children from families with higher income were found to be better at decision making and risk adjustment in the decision-making task. They deployed greater strategy, fewer errors and faster response in the spatial working memory task. The pattern was similar for those whose parents had higher levels of qualifications compared to those with no qualifications.
There is substantial concern across all the main political parties with promoting social mobility. But our findings indicate that achieving equality of opportunity will be a challenge in the face of substantial income inequalities in the UK. They also indicate that schooling is not sufficient to correct for the influence of more advantaged parents on their children’s cognitive development.
Patterns of poverty
These implications for the challenges in delivering equality of opportunity are especially salient given the patterns of poverty also identified in the Age 11 findings.
Each MCS survey used a relative measure of poverty that identified those families living on less than 60% of the typical income for families with children of this age. This income measure is strongly associated with material disadvantage – measured by asking whether families can afford to replace or repair core electrical goods, or having their child’s friends round for a snack. Such measures give an insight into what living on a low income means for these families.
The second graph below shows patterns of relative poverty over the lives of the MCS children. There was considerable movement between being in poverty and being out of poverty from one survey to the next. This meant that slightly more than half of the children (53%) had lived in a poor family at some point over the course of the five surveys. Low income is not just a feature of a minority of children’s lives.

At the same time, nearly one in five, or 17%, of the children were poor at the point of four or five of the MCS surveys. Such persistent poverty is widely recognised as being worse for children’s outcomes than being poor at one point in time. The findings from the MCS showed that those who were persistently poor were more likely to be living in deprivation. These persistently poor children will also face the impact of low income on their cognitive development across childhood.
Impact on well-being
There were also small but significant differences in child well-being among those children who were persistently poor, compared to those who were never poor. Subjective measures of well-being are regarded as an important complement to material measures of well-being. Subjective measures invite people to say how they feel about their lives, for example how happy or satisfied they are with their lives overall. Material measures include measures of income or deprivation.
The children in the survey were, broadly speaking, very satisfied with their lives at the age of 11 – and this was generally true across children from all sorts of circumstances. The average score on a seven-point scale was just over six for children overall. It was just over 6.1 for children who had never been poor across the survey and it was just under six for those who were persistently poor. Although the difference was small, it was clear that poverty can have an impact, not only on cognitive attainment, but also on how children feel about their lives.
Next read: One third of 11-year-olds in the UK are overweight or obese