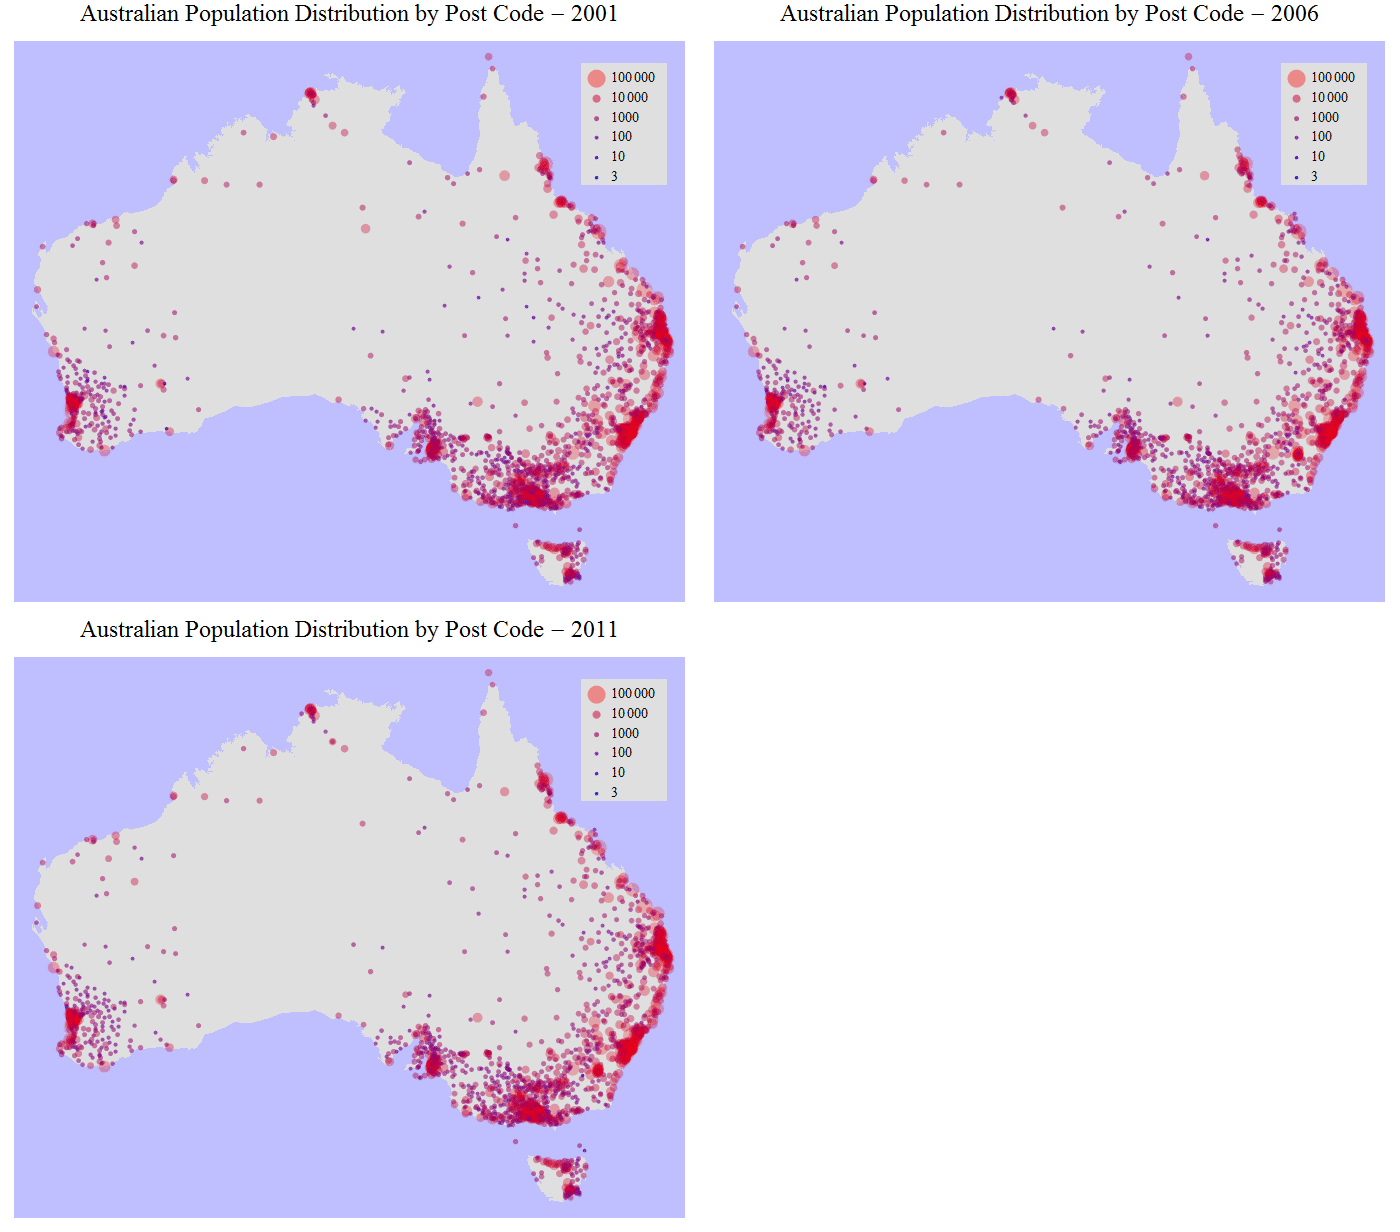
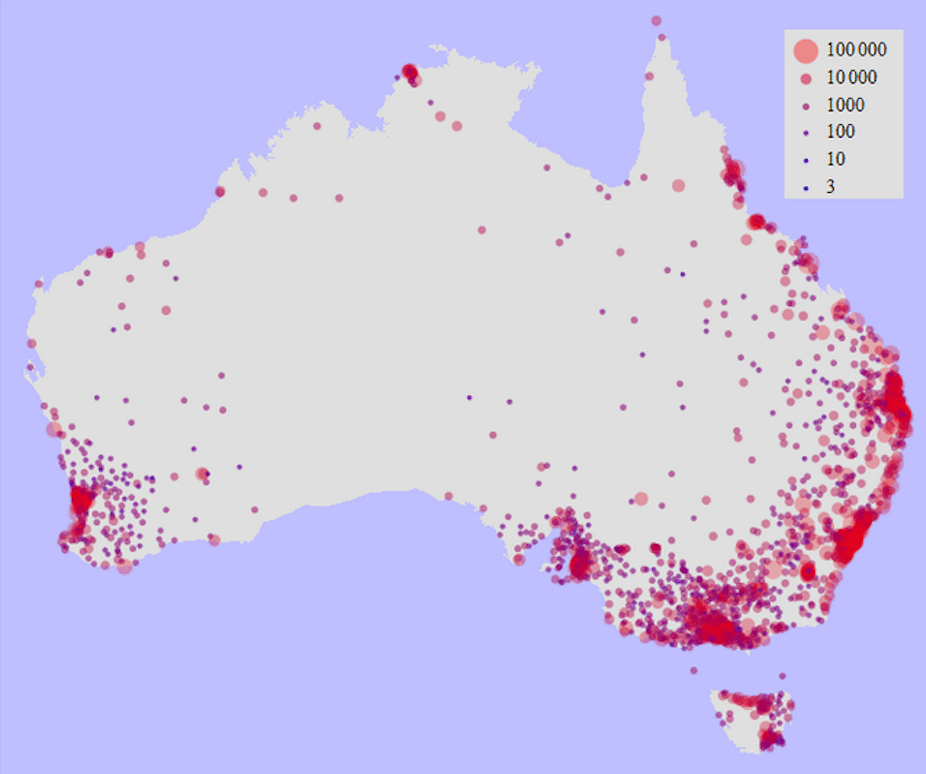
AUSTRALIA BY NUMBERS: The Australian Bureau of Statistics has released the first batch of its 2011 census data. We’ve asked some of the country’s top demographers and statisticians to crunch the numbers on Australia’s population: how we live, where we work, who our families are and how we spend our time.
Today, demographer Siew-Ean Khoo gives the lowdown on what the 2011 census told us.
There were 21,727,200 people in Australia on August 9 last year, according to the first results of the Census released today.
According to the Australian Bureau of Statistics (ABS), Australia’s resident population (excluding overseas visitors) was 21,507,700, so we are 8.3% bigger than we were in 2006.
The 2011 census provides important information on the characteristics of Australia’s population, such as residential location, ancestry, birthplace, Indigenous status and religious affiliation, and shows how the population has changed over the past five years.

States of the nation
Census data show that while New South Wales is still Australia’s largest state, with a population of 6.9 million people, its population had increased by an average of just 1.1% per year since the 2006 census.
Western Australia’s population has grown the fastest, driven by the resource boom and labour force needs of the mining industry. WA’s population grew at an average rate of 2.7% per year in the five-year period to reach more than 2.2 million in 2011.
At the other end of the scale, Tasmania had the lowest population growth rate with an average of less than 1% per year or 4% for the five years between 2006-2011. Its population in 2011 was 489,000.
Race and religion
The 2011 census also showed that 24.6% of the population was born overseas, with the four largest overseas birthplace groups being the United Kingdom, New Zealand, China and India.
These countries have been the four largest sources of overseas migrants over the past ten years. India and China have also been the two largest sources of overseas students in the past five years.
Consistent with China and India being the third and fourth largest birthplace groups, Mandarin has become the next most common language spoken in Australia after English. Mandarin is spoken at home by 1.6% of the population, or about 350,000 people.
Close to 550,000 people, or 2.5% of the population, identified as Aboriginal or Torres Strait Islanders in the census. This is a small increase from 455,018 or 2.3% in 2006. One-third (32%) of the Indigenous population lived in New South Wales in 2011 and 10% lived in the Northern Territory.
The numbers of Hindus has grown fastest of all religious groups since 2006, increasing from 148,130 in 2006 to 275,534 in 2011.
Nearly one in four people (22% of the population) said they had no religion in this census. This is an increase from 19% in the 2006 census and a continuation of a trend that has existed since the 1970s.
More to come
Data from the 2011 census will continue to be released by ABS over the next six months.
They will be used by government, business and academic researchers to study the demographic, social and economic changes in Australia’s population in the first decade of the twenty-first century.

