
On voting intention, the 2015 budget has had a mild impact, but is a continuation of a slow trend to the Coalition. The table below gives the two party results for all six polls conducted since the budget. While there are big swings to the Coalition in Galaxy and Ipsos polls, these swings were to be expected, as explained below. The worst result for Labor is not the 50-50 tie in Ipsos, but the 51.5-48.5 Labor lead in Morgan, a Labor-leaning pollster.
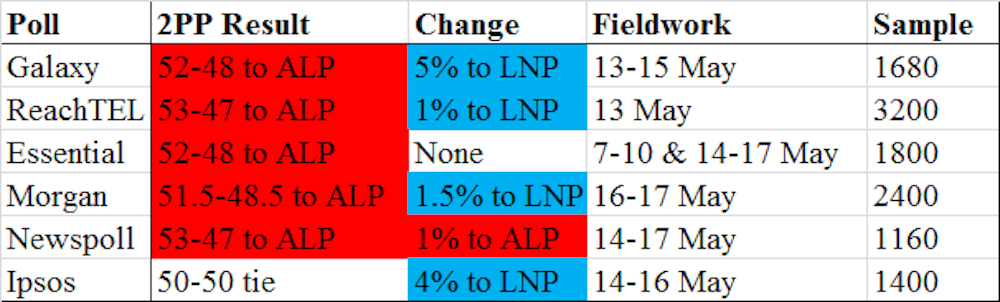
The 5% shift to the Coalition in Galaxy is because the last Galaxy was taken over three months ago, following the Queensland election result and the knighting of Prince Philip. The Coalition has had a big improvement in other polls since that period.
Ipsos’ last poll in mid-April was a pro-Labor outlier from a pollster that leans towards the Coalition. As other polls have shown a continued improvement for the Coalition, it is not surprising that Ipsos is now showing a 50-50 tie. Though this pollster leans to the Coalition, this is the first poll to show a tie since prior to last year’s budget.
Labor appears to have lost its advantage on respondent allocated preferences compared with the previous election’s preferences. Respondent allocated preferences in Ipsos were also 50-50, the same as the previous election method. Morgan’s respondent allocated preferences were 51-49 to Labor, 0.5% worse for Labor than the previous election method. Up until about one month ago, Labor was consistently winning 1% more on respondent allocation.
Abbott’s ratings have continued to improve. Newspoll has Abbott’s net approval rating at -13, up from -19, Ipsos has a net approval of -8, up from -26, and ReachTEL gives Abbott a (total good) minus (total poor) rating of -22, up from -27. The huge change in Ipsos’ ratings for Abbott reflects the big shift in voting intentions between the two Ipsos polls.
Shorten’s ratings have steadied after a steep decline. Newspoll gives him a net approval of -11, up from -16, Ipsos has him at -4, down from -2, and ReachTEL at an unchanged -16.
Abbott’s ratings have now improved for the sixth straight Newspoll, and he has improved 31 net points from the early February poll that had him at a -44 net approval. Much of the early rebound came because people forgot the “Knightmare” affair, but Abbott’s gains in the last five weeks probably reflect some public relief that this budget was not as harsh as last year’s budget. A key question is whether Abbott’s ratings will continue their improvement now that the budget has actually being delivered.
After becoming disconnected for about two months during the NSW election campaign and aftermath, voting intentions and Abbott’s Newspoll ratings are strongly aligned again. If Abbott’s ratings slump again, the Coalition is likely to also slump. However, a continued improvement for Abbott would allow the Coalition to take the polling lead.
Kevin Bonham’s poll aggregate is now at 51.8% Two Party Preferred (2PP) to Labor, a 0.5% gain for the Coalition since last week. This is the closest the Coalition has come since October 2014.
The Poll Bludger’s BludgerTrack has Labor leading by 51.6-48.4, a 0.7% gain for the Coalition since last week. Primary votes are 41.5% for the Coalition, 37.3% for Labor and 11.7% for the Greens, with the Coalition vote up 1.0% since last week at the expense of Labor and Others. On current votes, Labor is projected to win only 74 of the 150 seats, to 71 for the Coalition. This highlights the fact that Labor needs at least a 52-48 2PP win to be confident of a majority, while the Coalition would probably win a majority with a 51-49 popular vote deficit, as happened in 1998. BludgerTrack graphs continue to show the strong rebound in Abbott’s ratings since his nadir in early February.
Perceptions of the budget
Newspoll has asked three standard questions after every budget since 1986: whether the voter will be personally better off or worse off, whether the overall economy will be better or worse, and whether the opposition would have delivered a better budget.
This budget was perceived to be much better than last year’s budget. On personal effects, 20% said they would be better off and 30% worse off; in 2014, this split was 69-5 in favour of worse off. By 46-28, voters thought the economy would be better off; last year this was 48-39 in favour of worse off. By 51-36, respondents thought that Labor would NOT deliver a better budget; last year that was 46-39 against Labor.
Coalition governments are generally perceived as better economic managers than Labor governments. While this budget is perceived as the best since 2008 on economic and personal effects, the Howard government had some much bigger margins. Labor’s 15-point deficit on whether the opposition would deliver a better budget is better than it was under Howard until the Howard government’s final budget in 2007.
Ipsos gave the budget a +17 net satisfied rating, up from -32 last year. A +19 net fair rating is also a huge turnaround from -30 last year. In Ipsos, a net +25 said the budget would be good for Australia, a net +23 said it was economically responsible, and a net +5 said it would make them worse off. 81% approved of the small business rebate, but cutting family tax benefits to increase childcare subsidies was opposed by 47-39.
In Galaxy, 43% thought the budget would stimulate small business, with 28% disagreeing. 30% thought the budget improves the government’s economic credentials, but 28% thought it showed the government is a poor economic manager.
Unlike other pollsters, ReachTEL has Shorten preferred as PM over Abbott by 57-43, but this is because ReachTEL has no “don’t know” option on its preferred PM question. 16% said they would be better off after the budget, 30% worse off and 53% thought they would be about the same as before. When forced to choose whether the budget was better for families or businesses, 80% selected businesses.
In Essential, a net +1 approved of the government’s handling of the budget; last year a net -22 disapproved. A net -5 thought the economy was heading in the wrong direction, virtually unchanged on August 2014. By 45-15, respondents thought this year’s budget was better than last year’s. A net +60 thought the budget was good for small business, but a surprisingly lukewarm net +8 thought it would be good for the economy, unchanged on 2014. A net +35 said the budget favours businesses over workers, and a net +31 said it is more about improving the government’s popularity than improving the economy.
Three options were put on a “budget emergency” question. 19% thought that there was a budget emergency, and that this budget will bring the overall budget back into line. 32% said there was a budget emergency, but this budget would not help, and 30% said there was no budget emergency. In 2014, these percentages were respectively 32%, 24% and 32%.
Why were the UK polls so wrong?
The final polls for the United Kingdom election all had the Tories and Labour within a point of a tie. The actual result was a Tory win over Labour by 6.6%. Here are some plausible reasons for this huge miss.
While the pollsters’ estimates of the vote for the UK Independence Party (UKIP) were accurate, UKIP’s anti-immigration rhetoric probably had more appeal to socially conservative Labour voters than the pollsters thought. The high vote for UKIP was expected to hurt the Tories by taking many more Tory than Labour votes, but it appears that those who voted for UKIP were more even in their former support than pollsters anticipated.
At 66%, election turnout was much lower than anticipated by pollsters. Many pollsters had well over 70% “absolutely certain to vote”. Conservative voting demographics are more reliable than those who vote Labour, so this error damaged Labour. Compulsory voting in Australia means that Australian pollsters do not need to estimate likelihood to vote.
Many pollsters had 15% or more in the “don’t know/refused to say” categories. Pollsters need to push these people to say which way they are leaning, but the UK pollsters do not appear to push.
UK polls were conducted by both phone and Internet panel methods. However, the Internet panel polls may not accurately represent the electorate. People who are interested in politics would be more likely to join a panel than those who only think about politics late in an election campaign. This means that Internet panel polls may be based on a biased subsample of the electorate.
Prior to the final week, phone pollsters gave the Tories about a two-point advantage relative to the Internet based polls. The final days showed the phone pollsters converging to where the Internet polls had been. It is likely that “herding” is to blame for this; this is where all polls converge because they are all too afraid to give a result that looks like an outlier. But sometimes the outlier result is correct, and the consensus is very wrong.