At the G20 meeting in Brisbane on the weekend we are going to hear a lot of talk about current accounts, GDP, CPI as well as a whole blizzard of more obscure acronyms and economic measures.
To help you make sense of it all we have prepared the following 12 charts to provide what we hope will be a useful guide to the G20; who’s involved, what role they play and an explanation of key economic terms.
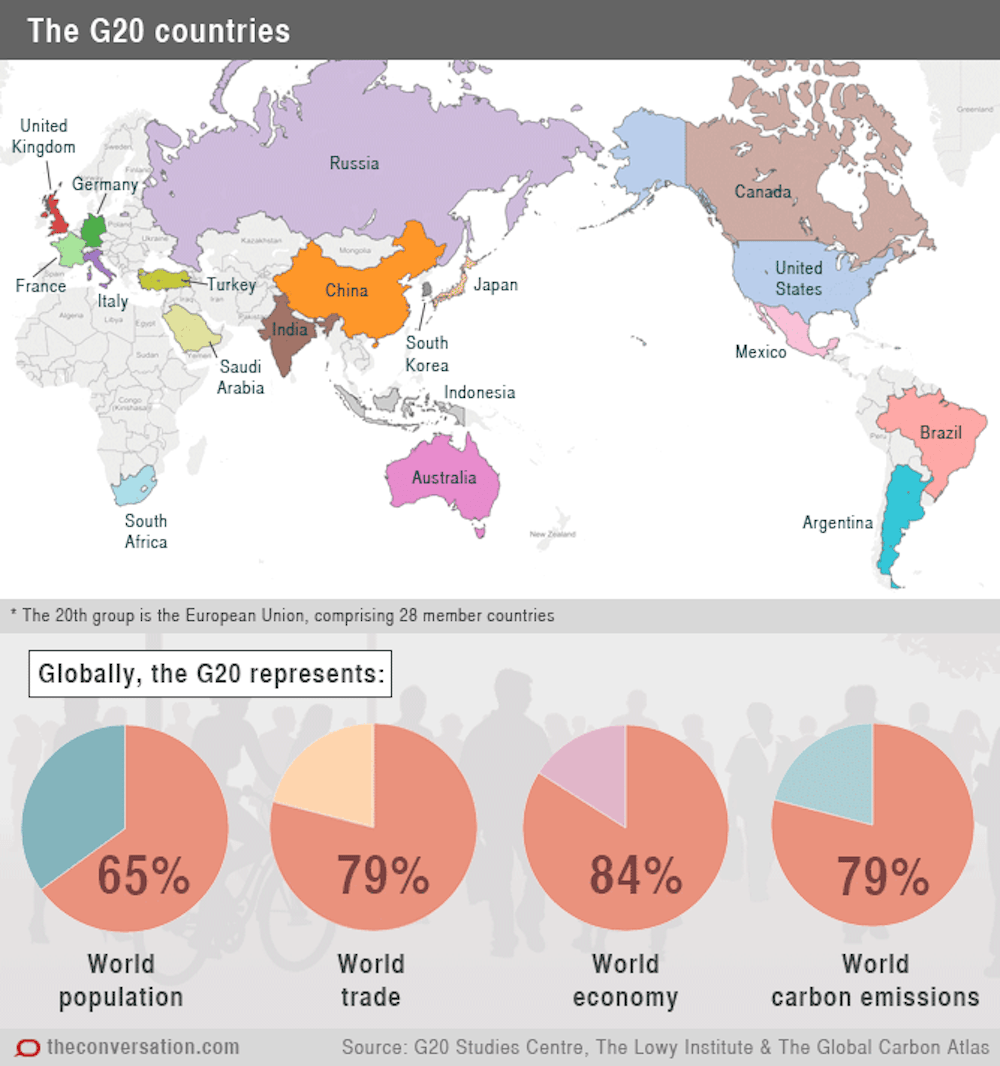
The G20 countries
The Group of Twenty (G20) includes the world’s major economies, comprising 19 countries and the European Union.
The G20 is primarily a forum to discuss economic issues and cooperation among members, and was started in 1999 after the Asian financial crisis. The first official G20 summit was held in 2008 partly in response to the global financial crisis.
As well as the permanent 20 members, each year the G20 president invites guest countries to attend the Leaders’ Summit. Spain is considered a “permanent invitee” and is always invited. This year, Australia has invited New Zealand, Singapore, Myanmar (2014 Chair of ASEAN), Mauritania (2014 chair of the African Union) and Senegal.
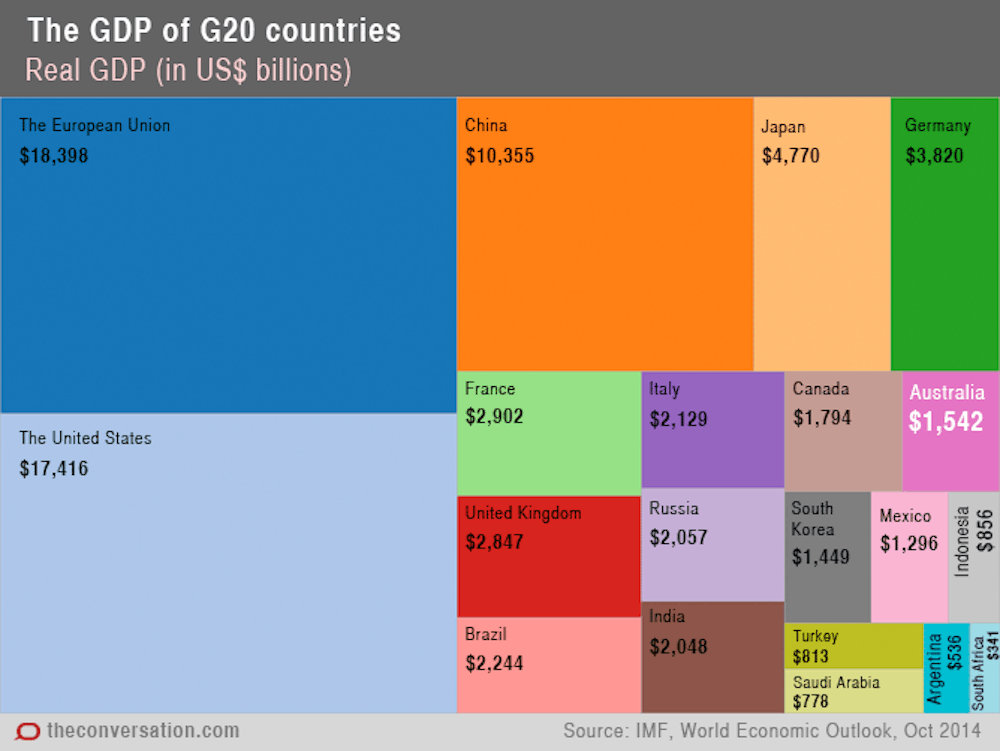
Gross domestic product (GDP)
The GDP of a country is the total market value of all goods and services it produces in a given year, and is often used to measure the size of a country’s economy.
There are different ways of calculating the GDP of a country, and figures from institutions such as the International Monetary Fund (IMF) may differ to GDP calculations from The World Bank.
Membership to the G20 is not determined by the size of a country’s GDP alone, as countries such as Spain, Netherlands and Switzerland generally have a GDP that would place them in the top 20.
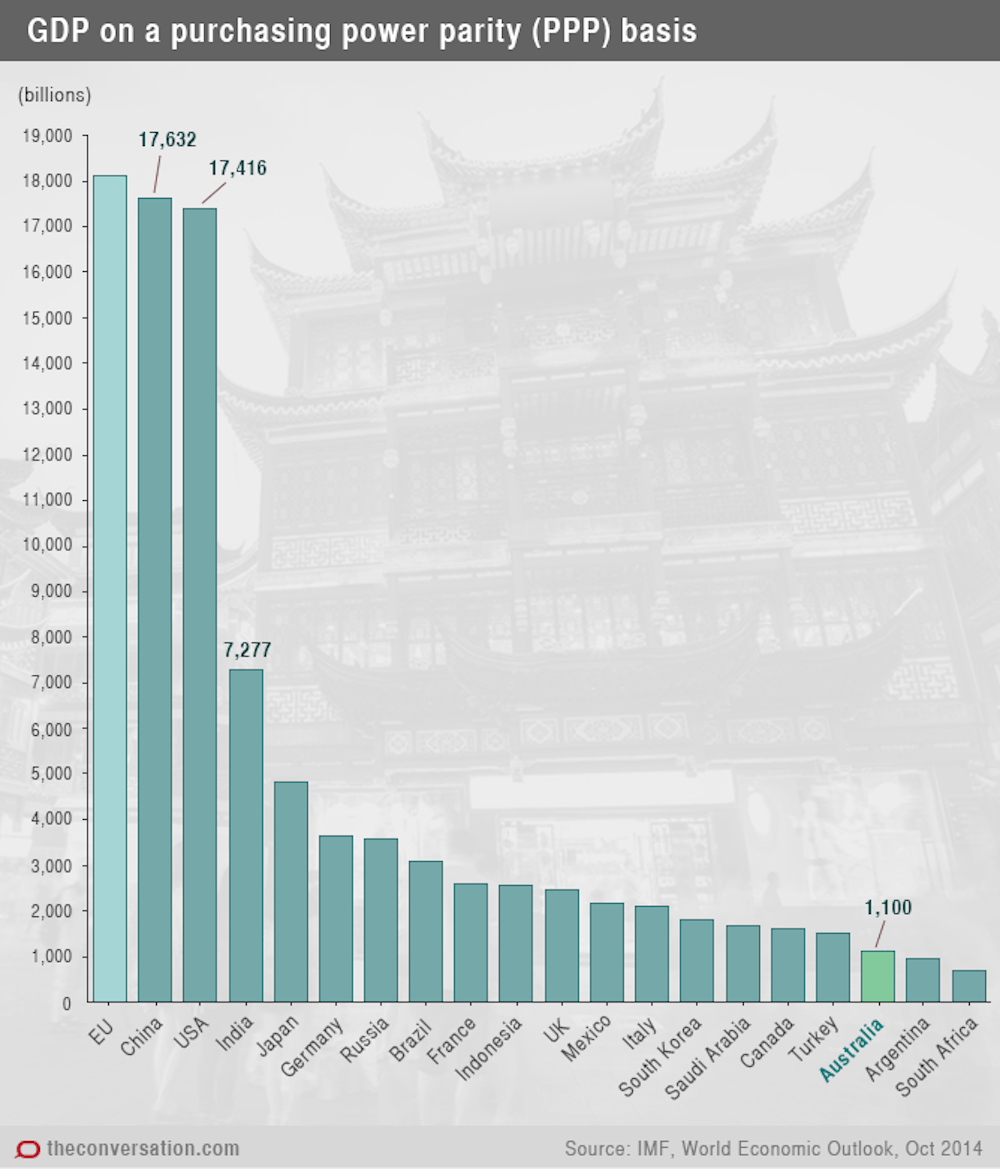
The USA clearly has the highest GDP of any single country.
But when considered on purchasing power parity (PPP) basis, the International Monetary Fund (IMF) estimated that China overtook the USA this year. PPP is considered a better measure of the size of an economy than real GDP because it is not influenced by the volatility of exchange rates and accounts for the cost of living in comparative countries.
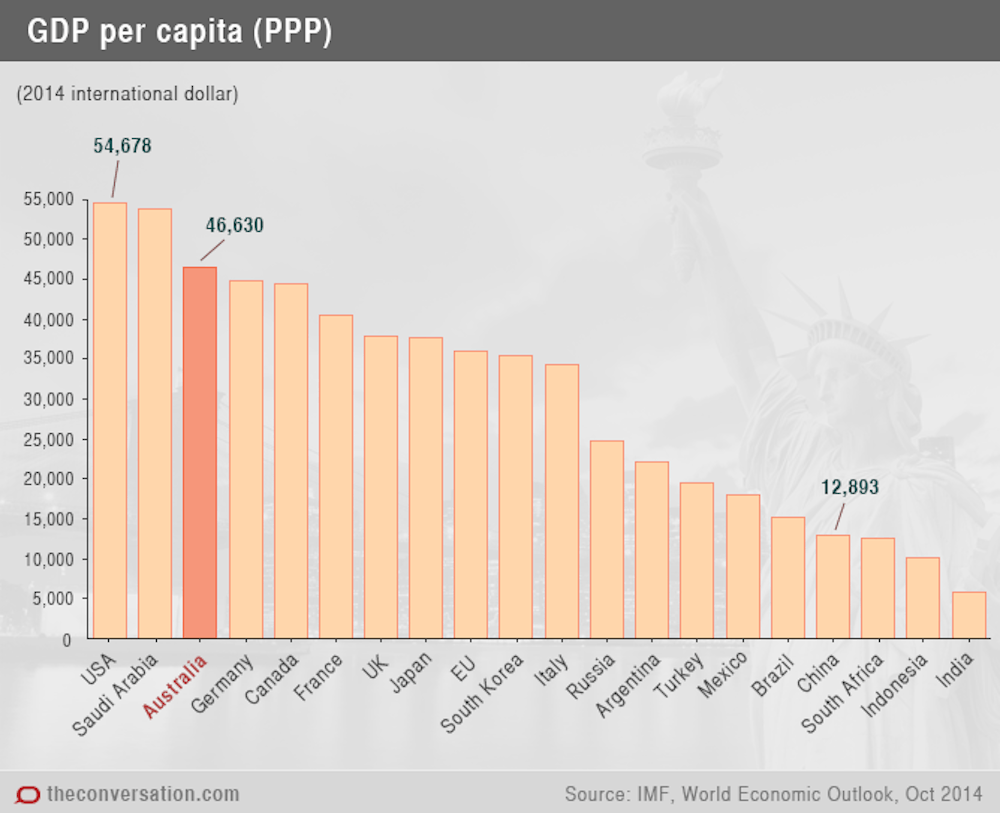
If we look at GDP per capita, the order changes again. Countries such as Qatar and Singapore, with their relatively low population and high production, have the highest GDP per capita on a PPP basis.
Among G20 countries the US ranks first; China and India, both with a population of over one billion, drop down the list.
The current account balance
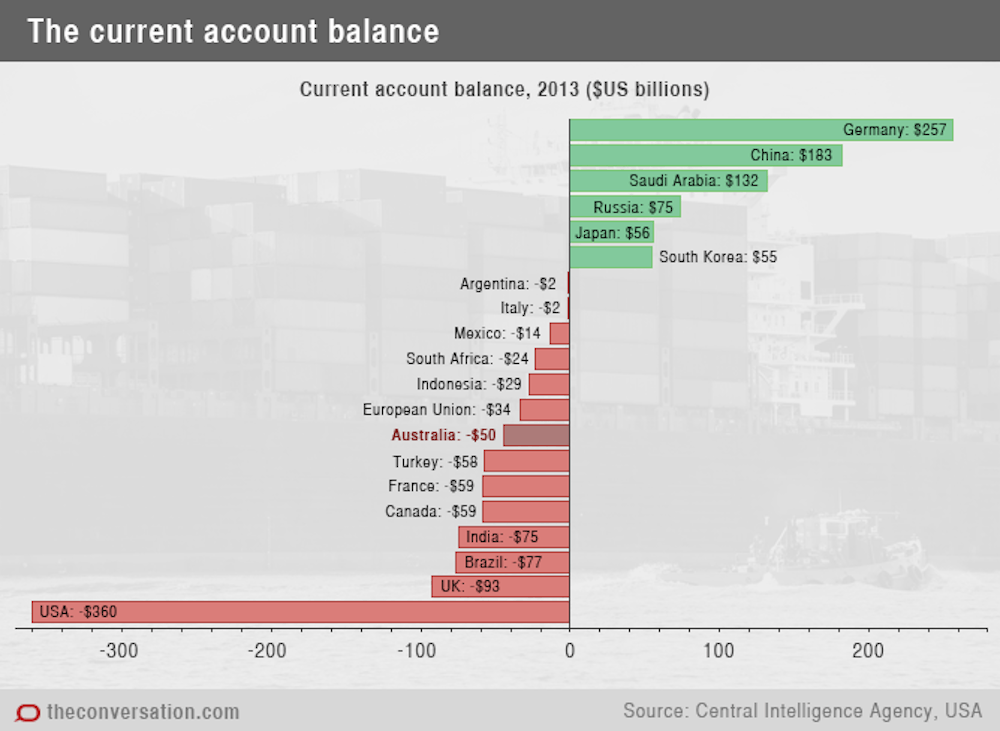
The current account balance is a measure of a country’s trade and compares the value of goods and services a country exports with the value of goods and services it imports.
Only five of the G20 countries (out of the 19) have a current account surplus, meaning the value of their total exports exceeds the value of the goods and services they import.
Government debt
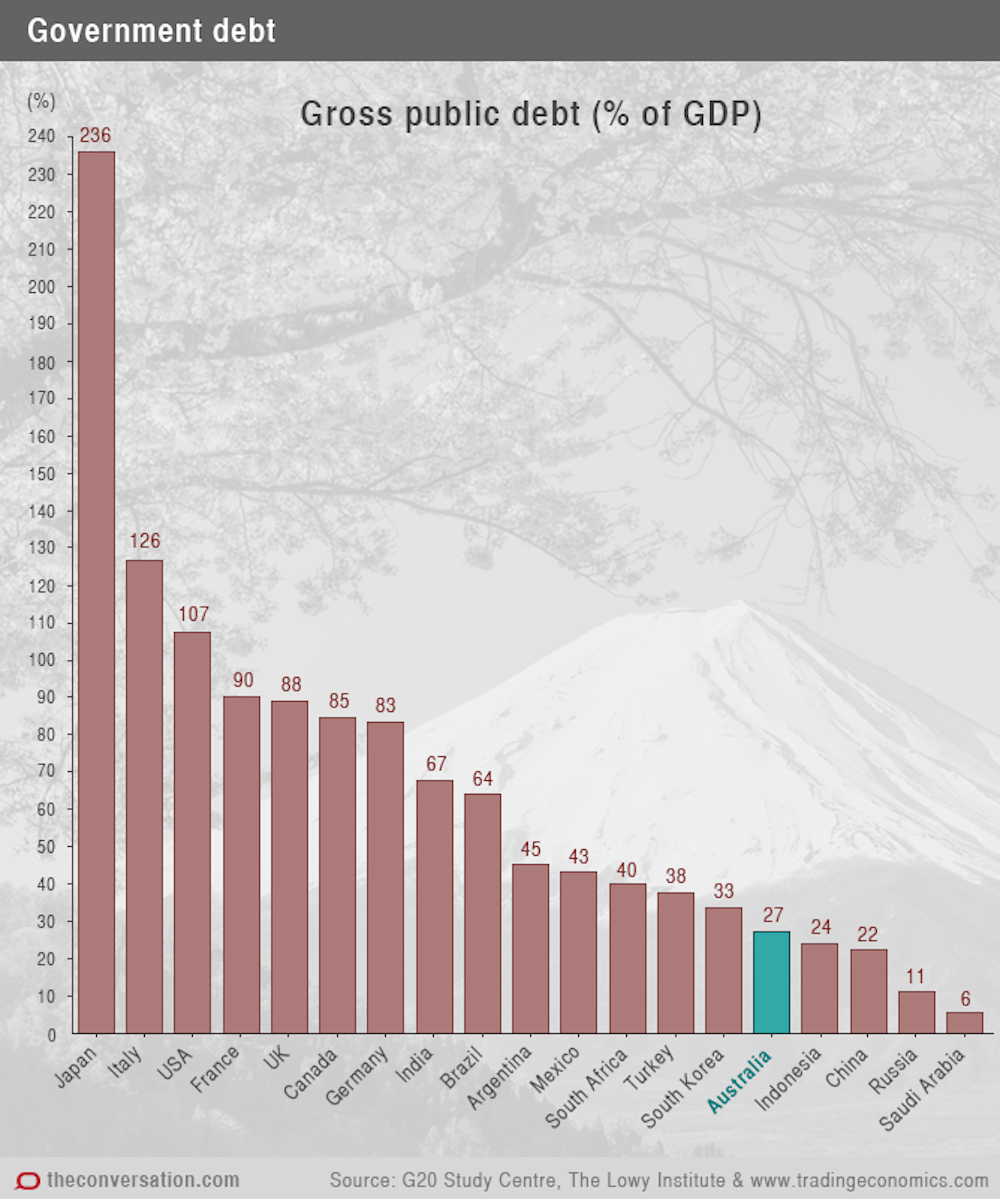
A government’s gross debt (or public debt) is the debt owed by the country’s central government. It indicates the size of the debt owed, but does not show whether a government can repay that debt. Net government debt is a country’s gross debt (the debt the country owes) minus what is owed to the government.
The 2014 federal budget estimated Australia’s net debt to be $226 billion, considerably less than Australia’s gross debt, which is about $343 billion.
As a percentage of GDP, Australia has a relatively low gross debt compared to other G20 countries.
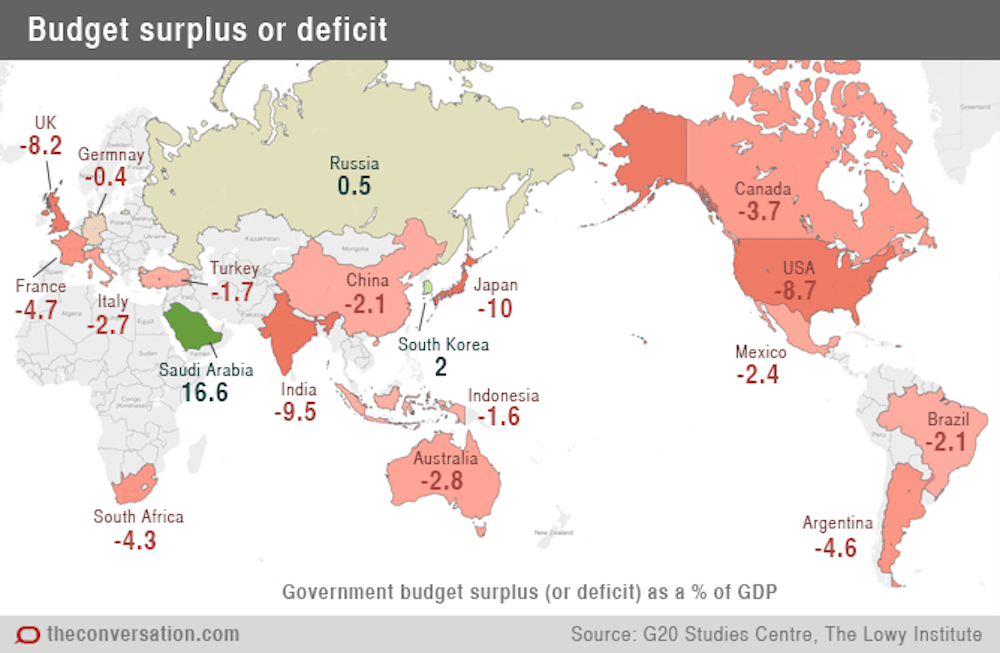
Government budget balance
The budget balance is the difference between a government’s revenue and its expenses for the financial year.
Most G20 countries have a budget deficit (ie. government spending is higher than its revenue). Only Saudi Arabia, South Korea and Russia have a budget surplus.
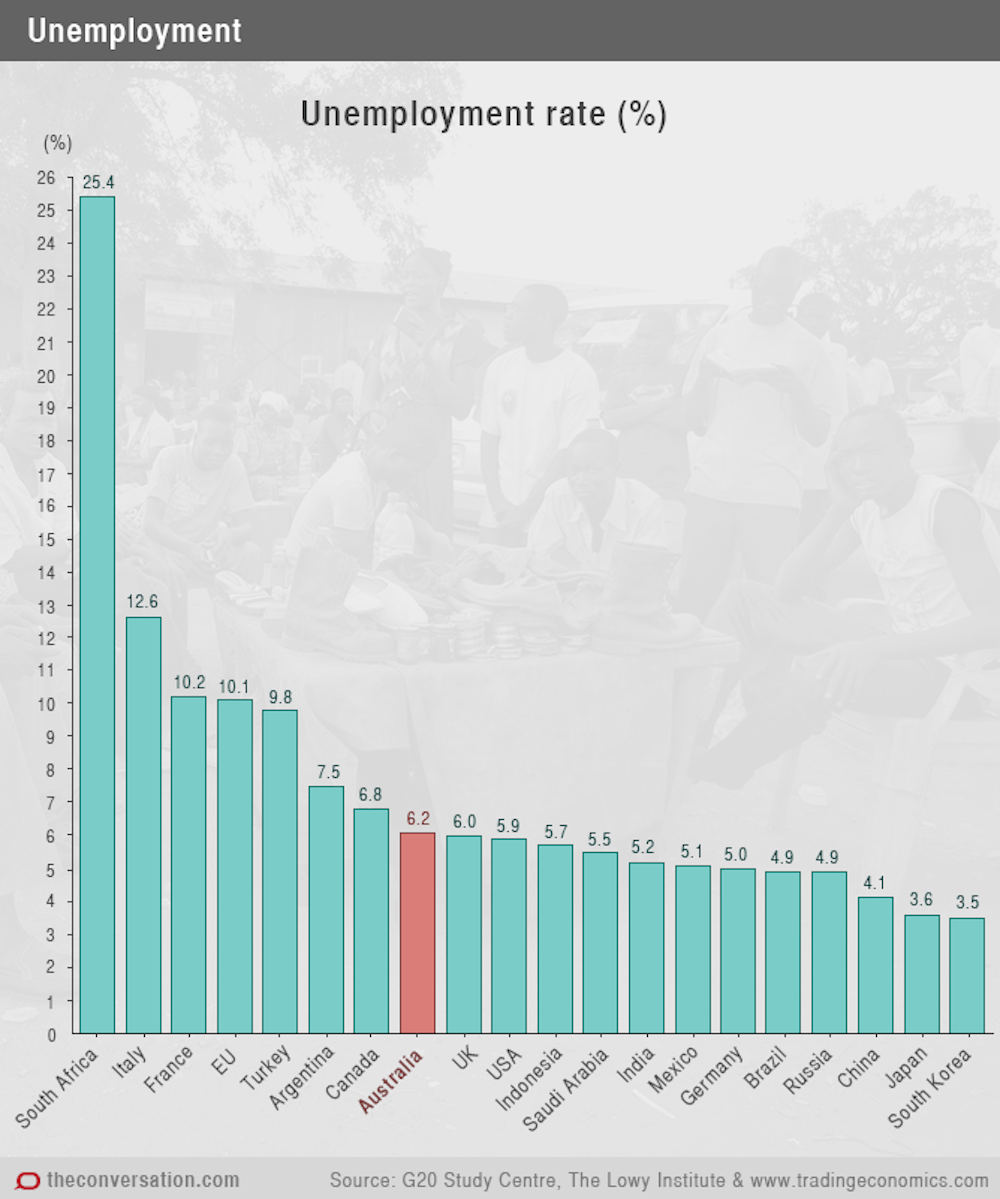
Unemployment
Of the G20 countries, South Africa clearly has the worst unemployment rate, with over 25% of the labour force unemployed.
Australia’s unemployment rate is currently 6.2%, up from 4.9% in April, 2012. It has a higher unemployment rate than 12 of the G20 countries.
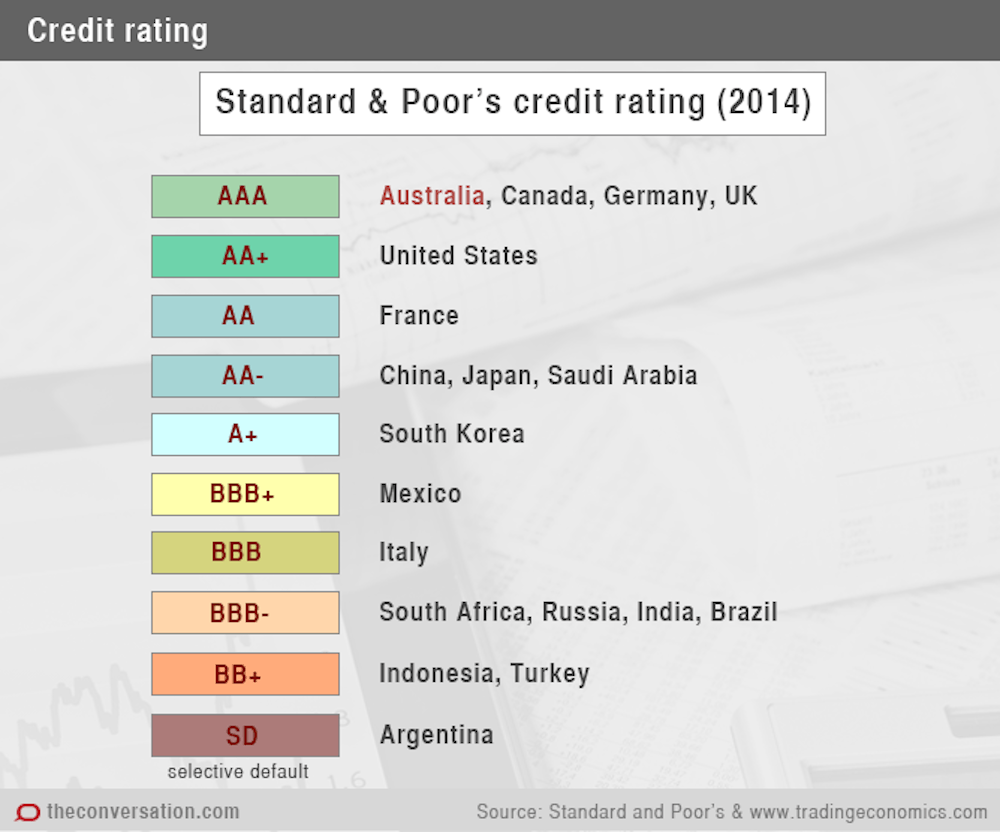
Credit rating
The big three credit rating agencies are Standard and Poor’s (S&P), Moody’s and Fitch.
Australia has the highest possible credit rating from all three agencies, along with Canada and Germany. S&P has recently raised the UK’s credit rating to AAA also (but Moody’s and Fitch still rate the UK’s credit slightly below the coveted AAA).
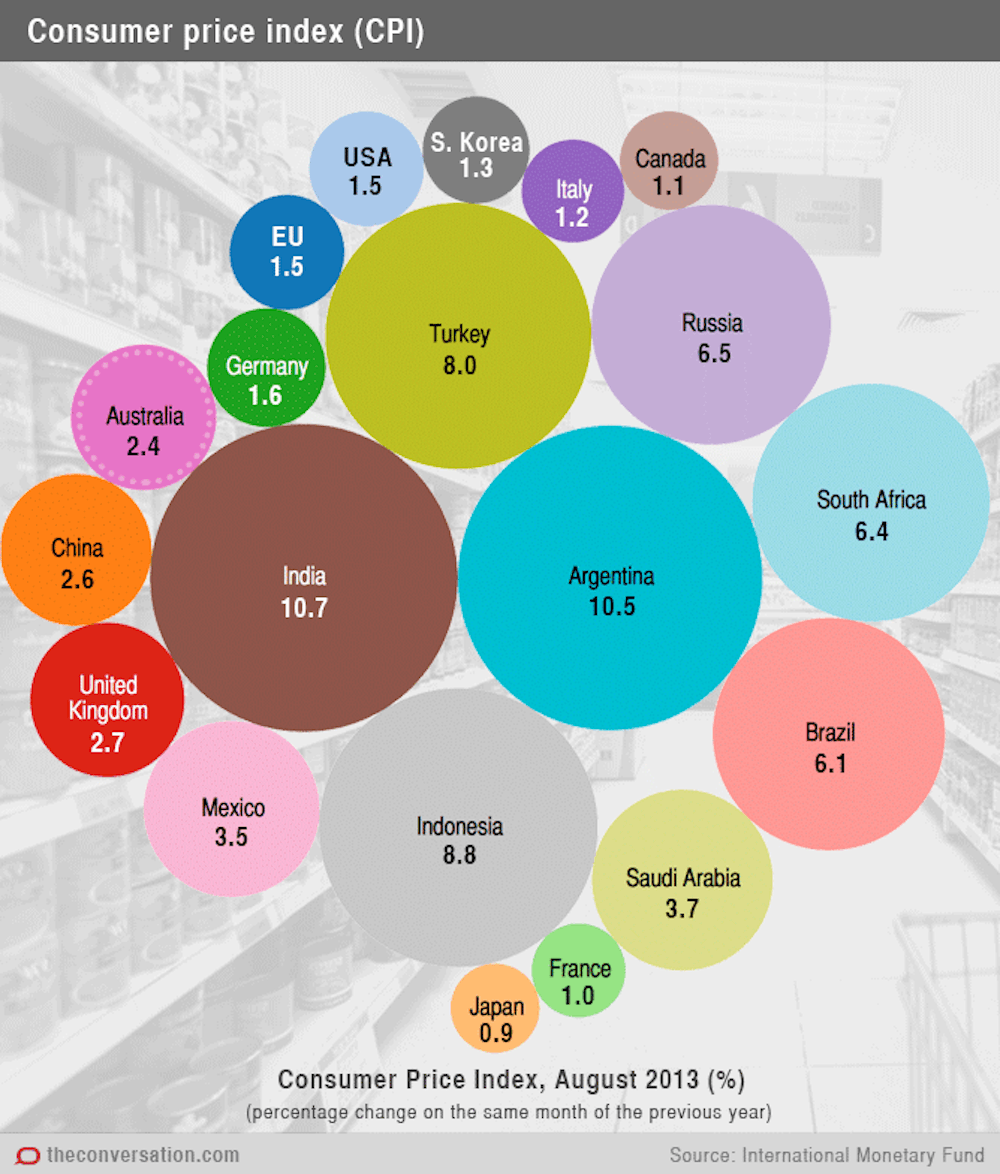
Consumer price index
The Consumer Price Index (CPI) attempts to measure how the retail price of a defined basket of goods and services changes over time.
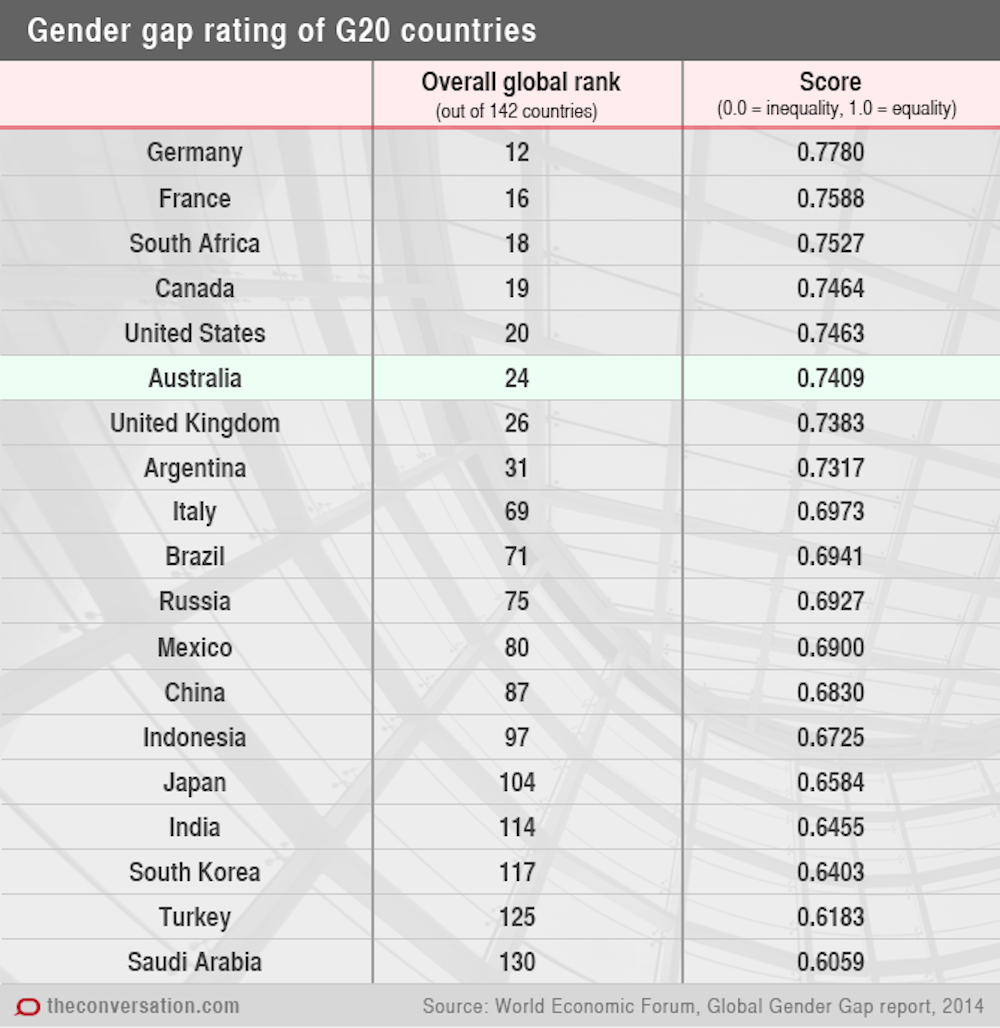
Gender gap
The Global Gender Gap Report was introduced by the World Economic Forum in 2006, and attempts to measure gender based disparities throughout the world. The 2014 report ranks 142 countries across four key areas: health, educational attainment, economic participation and opportunity, and political empowerment.
Scandinavian countries have the lowest overall gender inequality, with Iceland, Finland, Norway, Sweden and Denmark ranked in the top five. The G20 countries vary widely in the rankings, with Germany ranked 12th and Saudi Arabia ranked 130th.
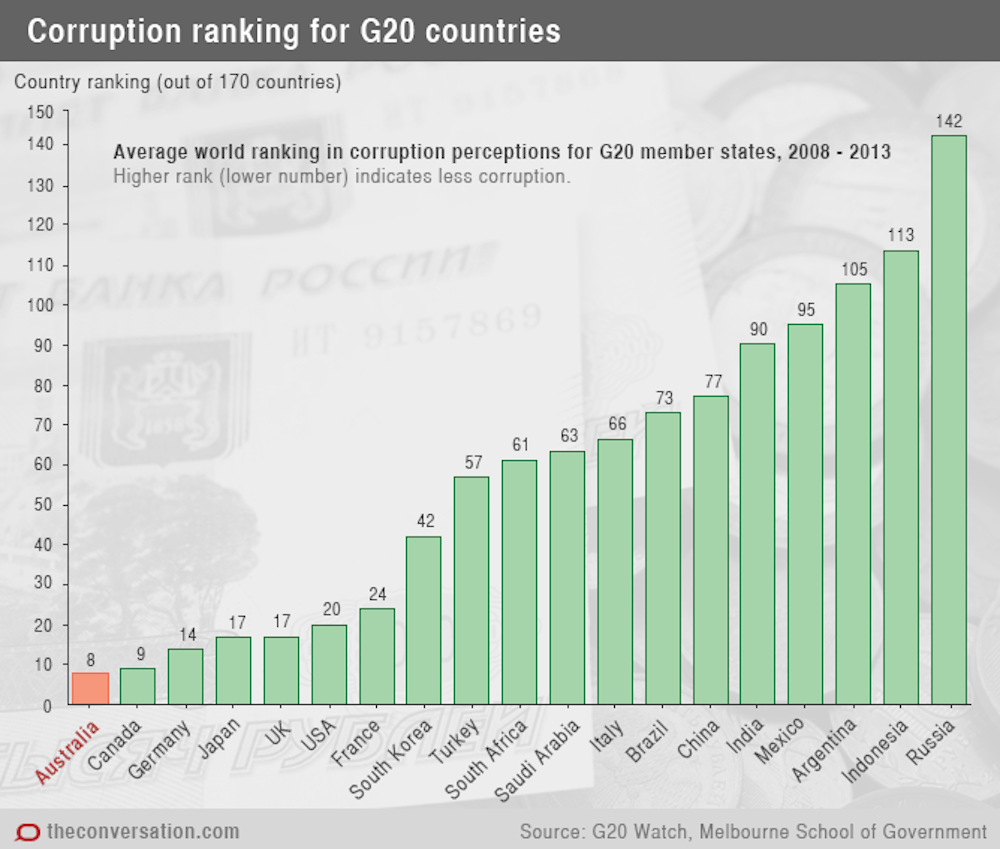
Corruption
Fighting corruption is one of the priorities at this year’s G20 summit.
G20 Watch ranked the member countries according to Transparency International’s corruption perception index, which measures the perceived levels of public sector corruption in over 170 countries.
On average, Australia and Canada have the lowest (perceived) corruption level among G20 countries, while Russia is clearly the worst, ranked 142 (out of 170 countries).