
The British economy has not been a pretty sight in recent years. GDP per capita was 15.8% lower in 2014 than we would expect from historical pre-2008 trends. Austerity has certainly played a role in this poor performance, but is George Osborne right to say that things would have been even worse if the pace of fiscal consolidation had been slower? And can we expect a different fiscal policy if a new chancellor comes into office following May’s general election?
Austerity past and present
The coalition government set its stall on balancing the country’s budget over a rolling five-year horizon. This is a good idea in “normal times”. Unfortunately, the situation in 2010 was not normal as interest rates were, and have remained near zero, rendering monetary policy relatively ineffective.
The usual economic advice in this situation is to increase government spending, but the coalition accelerated the austerity already planned by the outgoing Labour government, taking out an additional 1.2% of national income.
Austerity was particularly severe in the fiscal years 2010-2011 and 2011-2012 with a 40% real cut in public investment. Contrary to the standard medicine of increasing these in deep downturns (for example in road repairs), cutting them severely hurt output.
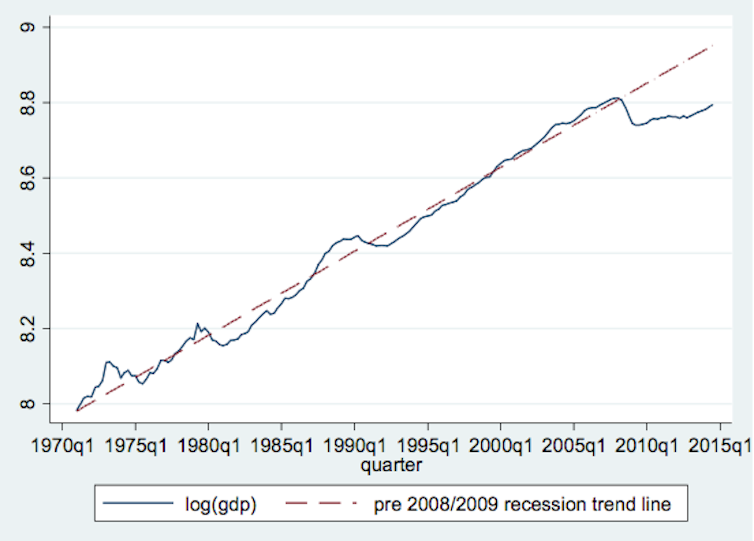
As the above graph shows, the GDP per capita trend line from 1970 up until the first quarter of 2008 (when the Great Recession began) was 0.6% per quarter. Growth from the second quarter of 2010 to 2014 was just 0.2% per quarter. After the nascent recovery of 2010 petered out, the coalition opted for a less contractionary fiscal position. The elimination of the structural deficit was wisely pushed forward into the next parliament.
Worst recovery in a century
To be sure, many factors outside the government’s control helped create the worst recovery this century. The eurozone crisis has had a drag on the UK, with the EU pursuing similar austerity policies. High commodity prices and the decline of high productivity sectors like oil and finance also slowed growth.
Taking such factors into account, the Office for Budget Responsibility estimated that 2% of GDP was lost due to austerity policies (1% in 2010-2011 and in 2011-2012). And this is likely to be a conservative estimate because recent research suggests much larger multipliers in severe downturns.
The main justification for accelerating austerity was that the UK faced the risk of a Greek-style debt crisis. This argument is implausible – unlike the eurozone, the UK has its own currency so liquidity crises do not become insolvency crises. The UK also had larger public debt levels – over 80% for half of the 20th century (1917-1968) – and avoided formal defaults.
Austerity future
In December 2014’s Autumn Statement, Osborne laid out his plans through to 2019-2020. His aim is to have a £21.6 billion surplus on the overall budget achieved through cutting public spending to just over 35% of GDP, the lowest level since 1948. This will come from reducing real spending on public services by 14.1% between 2015-2016 and 2019-2020.
The other half of public spending is welfare and this is projected to continue rising by 13%, mainly because of generosity towards pensions. For “unprotected” departments (all except health, schools and overseas aid) this means cuts of a quarter, following on from cuts of a fifth in the previous five years.
Real public service cuts per capita have never been achieved for more than two consecutive years since the series began in 1964-65 and the current plans imply ten years of continuous cuts.
Other parties
All parties agree on the coalition’s spending plans for the next year, cutting the debt over the next parliament and balancing the cyclically adjusted current budget deficit by 2017-2018. But there is disagreement over what should happen in the latter half of the next parliament.
Interestingly, all the three main parties could stick to their plans and be less austere than the 2014 Autumn Statement. The Conservatives are committed to balancing the overall budget by 2019-2020, not necessarily generating a surplus. Hence they could reduce real public spending by 8.3% instead of the 14.1% in the Autumn Statement.
By contrast, both Labour and the Liberal Democrats are committed to balancing the cyclically adjusted current budget, which excludes public investment. This means they could reduce spending by as little as 1.9% and 1.7% respectively and still meet their fiscal rules.
The question of whether public investment is included in the fiscal rule is an important one. It makes sense to treat capital differently from current spending as investment creates an asset which can aid growth in the future. And Britain has a poor track record on investment in transport, energy and housing compared to other countries. The Conservative plans would bring down the debt level more quickly but at the cost of lower investment, growth and employment.
The taxman cometh?
Another difference between the parties is over taxes. Conservative plans are to reduce taxes and have all austerity met through spending cuts. Labour too have announced several tax increases. But, like the other parties, they have not given much detail to their tax and spending plans.
All elections since 1992, however, have been followed by net tax increases of around £5 billion in today’s money. It is therefore incumbent on all political parties to be honest and spell out where their tax rises are likely to be.
This article is based on an Election Analysis for the LSE’s Centre for Economic Performance, which can be found here