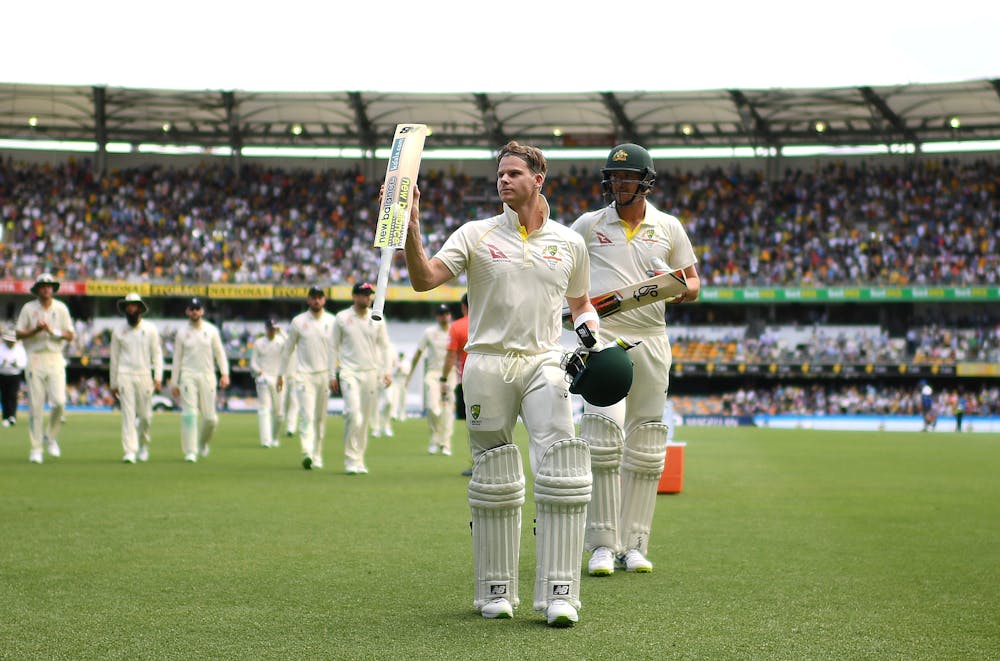
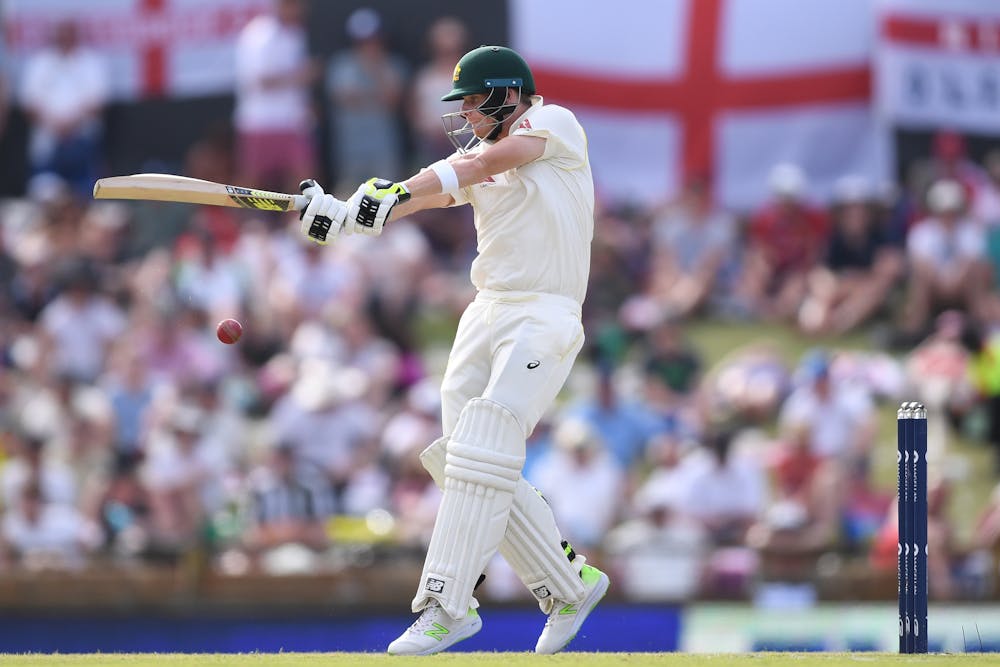
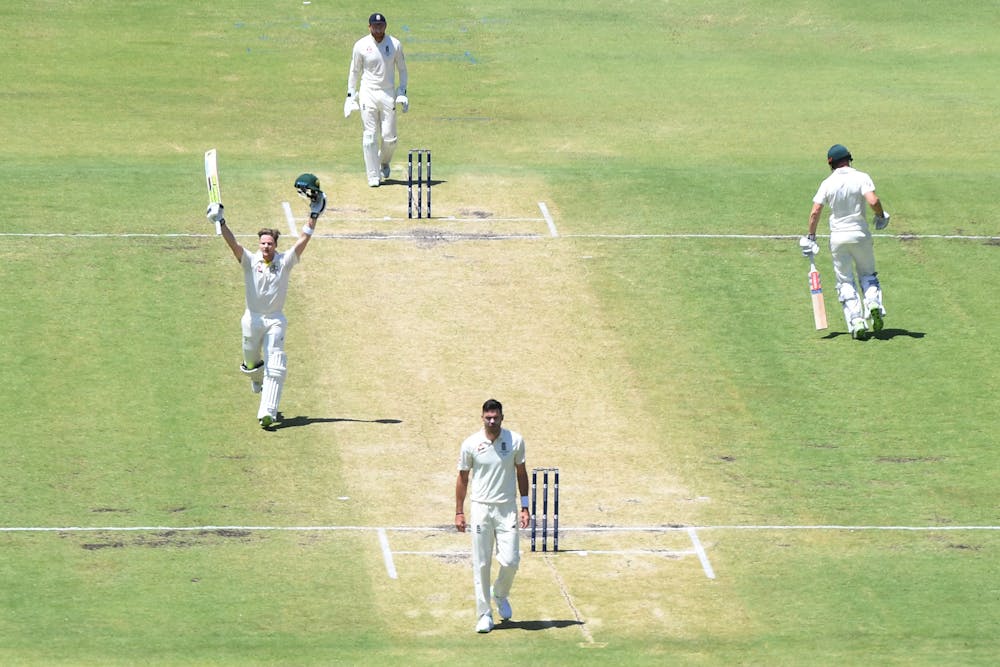
The Ashes may be over once again, but one of the biggest talking points during the cricket test series between Australia and England was the continued meteoric rise of Australian captain Steve Smith as a test batsman.
There was much speculation as to whether Smith is the best Australian test batsman – bar Donald Bradman – ever to have played the game.
“The Don” Bradman is widely regarded as the greatest Australian cricketer – and was voted the greatest cricketer of the 20th century – with an unrivalled test batting average of 99.94.
So what is the ranking of Australian test batsmen since Australia’s first ever test match in 1877?
Read more: Video explainer: How cricket captains make good decisions
Let’s crunch the numbers
We need to use some statistical modelling to answer the question. The dataset includes only batsmen who played a substantial number of tests for Australia, defined here by batting at least 30 innings.
“The Don” is removed from the dataset to allow the other players to be ranked without being affected by his exceptional performance.
All players who were considered predominantly bowlers have been removed from the dataset. All-rounders and wicketkeepers were retained, as these types of players might be expected to make substantial contributions with the bat. That leaves 108 players in the dataset.
A statistic commonly used to compare batsmen is their average: the total number of runs scored in their career divided by the number of times they have been dismissed.
If a player is not dismissed in an innings – the player is “not out” for whatever reason – then their score would effectively carry over to the next innings, at least from the point of view of the way the average is calculated.
For example, if a player scores 5, 57, 34 (not out) and 3, then this is the same as the player scoring 5, 57 and 37, giving an average of 33.
A changed game over the years
Just simply comparing averages may give misleading results, however. Cricket has evolved greatly over more than a century due to factors such as pitch conditions, professionalism, coaching, popularity and technology, to name a few.
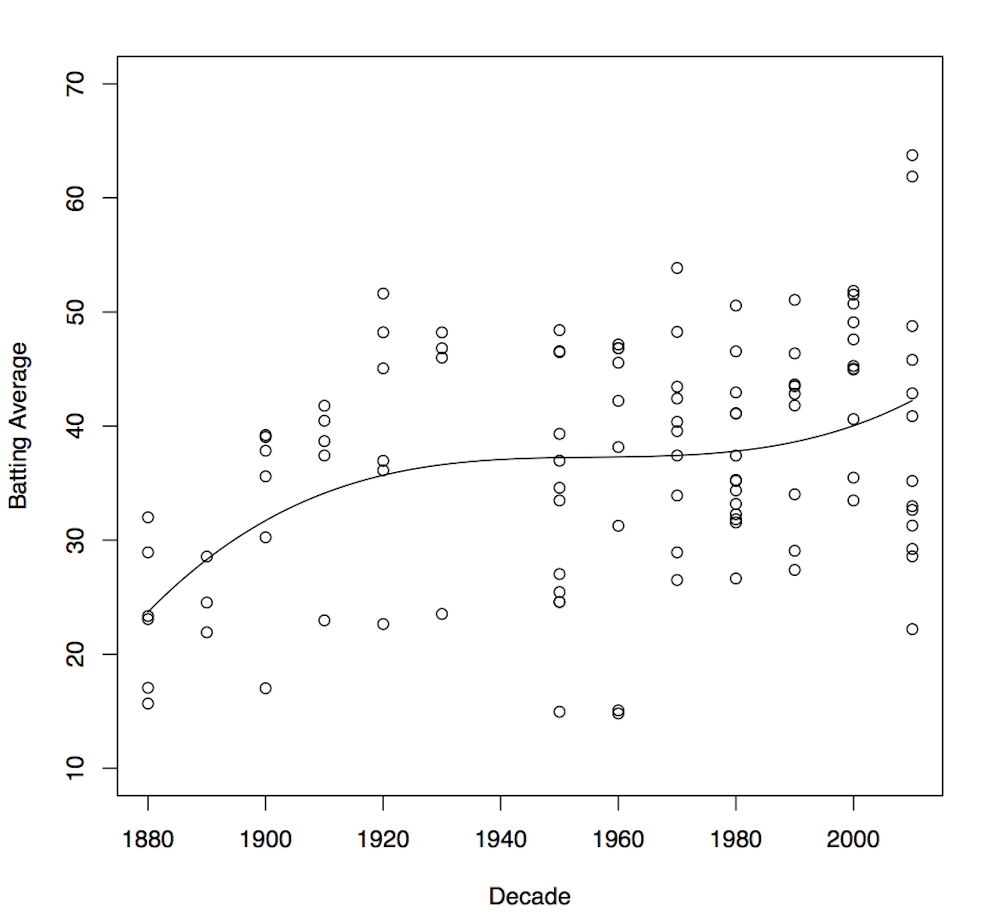
The graph above shows that test batsmen found run-scoring relatively difficult in the late 1800s and early 1900s compared with more recent times. So we need the statistical modelling to account for the decade in which the players played most of their test cricket.
The solid line in the graph shows that the statistical model can detect the general upwards trend of test batting averages. We can then adjust the results to account for this trend.

This gives us the top 15 Australian test batsmen of all time (bar Bradman) as determined by the statistical model. Note that only players who have played at least 25 matches are considered in the final ranking.
In the graph above, the black circle on the plot represents the relative score for each player. This is the score the statistical model predicts for a player’s batting average relative to the model predicted average from all players (where the model adjusts for the decade the player played).
For example, a relative score of 10 suggests that the player scores on average 10 more runs than a typical batsman in the same era. The horizontal grey line for each player shows the level of uncertainty in that figure, but we’ll come to that later.
Read more: Video explainer: Batting expertise and decision-making in cricket
The second-best batsman is…?
We see from the circle plot that Steve Smith has indeed received the highest relative score. Greg Chappell stands out as the next best.
The statistical model naturally shrinks the scores related to players who have played relatively few matches and/or scored inconsistently.
This is actually an advantageous feature of the model. A player who has managed to maintain a high average and play consistently over a long period of time should be rewarded.
And now the uncertainty
The statistical modelling approach not only provides an estimated relative score, it can also produce an interval that quantifies the uncertainty in the estimated score.
This is what those horizontal grey lines show in the graph above. They show there is a 90% chance that the player’s relative score is in that interval.
Although Smith has been allocated the highest relative score, there is substantial overlap in the score intervals of other players. This suggests that it is difficult to determine, from a statistical point of view, that Smith is a significantly better batter than the other players shown in the graph.
But the intervals do demonstrate that the players on this list are significantly better than a typical player from the corresponding era, as the intervals do not include 0.
The main reason for the large uncertainty is that a batter’s scores in individual innings fluctuate wildly. A batsman may get out for 0 runs in one innings and then score more than 100 runs in the next.
It is therefore difficult to home in on a batsman’s real average unless they were able to bat an extremely large number of times.
Read more: Video explainer: Bowling strategies and decision-making in cricket
The other reason for the wide intervals is that because a game of test cricket is so long (typically four or five days), each player is not able to bat many times, even if they have a long career.
A more rigorous statistical analysis would attempt to model the individual run scores of all the players directly rather modelling the average, which is simply a summary of a player’s batting career.
But the analysis has justified why many commentators, pundits and punters consider Smith to be the best Australian test batsman after Bradman – so far. Smith is still very much in the game so it will be interesting to see if he can maintain or improve on his recent performances.