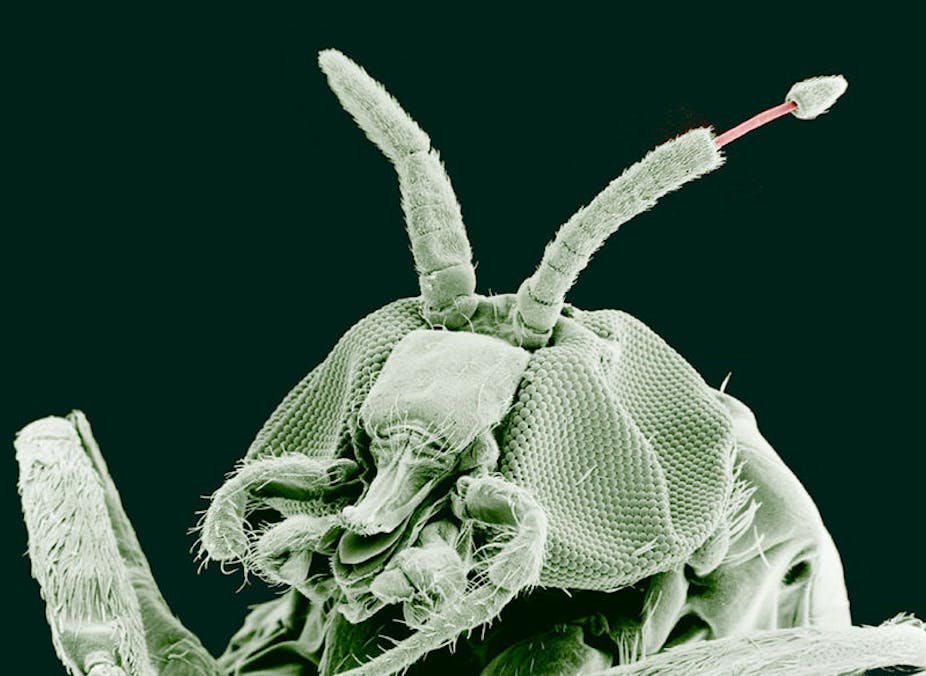
Onchocerciasis, or river blindness as it’s more commonly known, is a major public health problem in the wet tropics, and especially in tropical Africa. This eye and skin disease is caused by a filaria worm called Onchocerca volvulus that is spread to humans through the bite of an infected blackfly.
The common name of the disease acknowledges the blackfly’s preference for breeding near fast-flowing rivers, and as the first written European description by John Hanning Speake in Uganda in 1864 showed, blackflies are certainly not pleasant:
A small black fly, with thick shoulders and bullet-head, infests the place, and torments the naked arms and legs of the people with its sharp stings to an extent that must render life miserable to them.
Once inside the human body, the adult female worm produces larval worms that migrate in the skin and the eye. The long-term consequence of untreated infection is irreversible blindness, and it can cause skin disfiguration and disease, including nodules under the skin.

For many of the poorest rural communities in Africa, the statue of the blind man being led by a child outside the World Health Organisation’s headquarters in Geneva records an all-too-common experience.
End in sight

But there is a solution. The disease can be controlled by an annual prophylactic dose of a drug, ivermectin, which kills the disease-causing parasites before they can do lasting damage. Supplies of the drug are donated by the manufacturer, Merck, while the distribution and mass prophylactic treatment of affected communities is co-ordinated by the African Programme for Onchocerciasis Control (APOC), a WHO-supported partnership programme with 24 African member countries that has now reached approximately 100m people.

The distribution programme faces many challenges. Although the drugs themselves are donated, distribution costs are high; journeys to remote villages can take many days with roads poor to non-existent, fieldworkers encounter dangerous animals along the way, and some of the affected countries include war-zones.
One of the requirements for the programme is an Africa-wide map of disease prevalence, initially to inform decisions on prioritisation of areas for treatment, later to monitor the effectiveness of the programme.
Making a map
But how can we map prevalence without the disease registries and population census information that we take for granted in wealthy countries? Starting with a blank canvas, field-workers visit villages throughout sub-Saharan Africa and estimate prevalence by sampling 30 to 50 adults per village, examining them for symptoms of infection using a rapid, non-invasive diagnostic method developed by WHO scientists.
The sampled villages represent a small fraction of the population at risk, and any resulting estimates of prevalence are necessarily imprecise. To account properly for this imprecision we need a statistical model for the survey data.
The first ingredient in the model is a simple piece of statistical mathematics: if we sample 30 people, then the statistical margin of error in the observed prevalence is 100/√30, or about 18%. This is not only disappointingly large, it also tells us nothing about the likely prevalence in unsampled villages.
To do better, we appeal to what is sometimes called the first law of geography, which is that all things are related but close things are more strongly related than distant things. Finding out exactly how this law applies in any particular setting needs data, and a statistician.

For our river blindness mapping application, the heroic efforts of APOC field-workers have produced data from 14,473 sampled villages.
Careful statistical analysis allows us to calibrate the first law of geography against these data, and to produce a map of the estimated prevalence (above) throughout the APOC region.
How precise is the map? The average margin of error is now about 5%, considerably more precise than the 18% value quoted earlier.
Applying numbers to policy
To turn the prevalence map into a tool for decision-making, we need to look at APOC policy guidelines. These prioritise areas where prevalence is at least 20%. Without testing the whole population, we can never know for sure where these high-priority areas are, but we can use statistical methods to say how likely it is that any point on the map is in a high-priority area.

This gives a second map (right), which delineates high (red) and low (blue) priority areas according to APOC’s policy guidelines, with a narrow corridor of uncertainty between the two.
APOC has achieved an enormous amount since its foundation in 1995, and it continues to challenge itself. From 2016, it will become a new entity that will support African countries in the elimination rather than merely control, of river blindness and lymphatic filariasis – a parasitic infection also caused by filarial worms that but spread by mosquitoes that leads to elephantiasis. It’s an ambitious goal – and reliable mapping will help to realise it.

