
Polls ahead of the UK election not only point towards defeat for the government, but a veritable trouncing. With some showing below 20% support, the Conservatives have never polled worse. Some multiple regression and post-stratification (MRP) polls, which enable seat-level analysis, suggest record margins of defeat. One has the Conservatives winning fewer than 100 of 650 seats in the House of Commons.
Political scientists also point out that we might witness the largest two-party swing between elections ever recorded, the largest drop in support any party has ever experienced in a UK election and the lowest vote share for any major party.
What is less discussed, if at all, is that if any of these outcomes should come to pass, we may well be looking at one of the most (if not the most) disproportionate election result ever produced since universal suffrage. A huge Labour majority is likely to come off the back of a disproportionately small number of votes.
Follow the losers
It is well understood that plurality voting systems like the UK’s “first-past-the-post” system (FPTP), perform comparatively badly in terms of proportionality. It’s common for the number of seats in parliament that a party wins to be highly disproportionate to its share of the overall vote. More often than not, smaller parties suffer while the Conservatives and Labour benefit by receiving a higher number of seats than vote shares. This has happened in 13 of the 24 elections since 1928.
But this focus on how badly FPTP treats third parties obscures that the degree of disproportionality in an election depends almost entirely on the performance of the losing major party – both its absolute performance in terms of vote share, and its relative performance, in terms of how far it trails behind the winner.
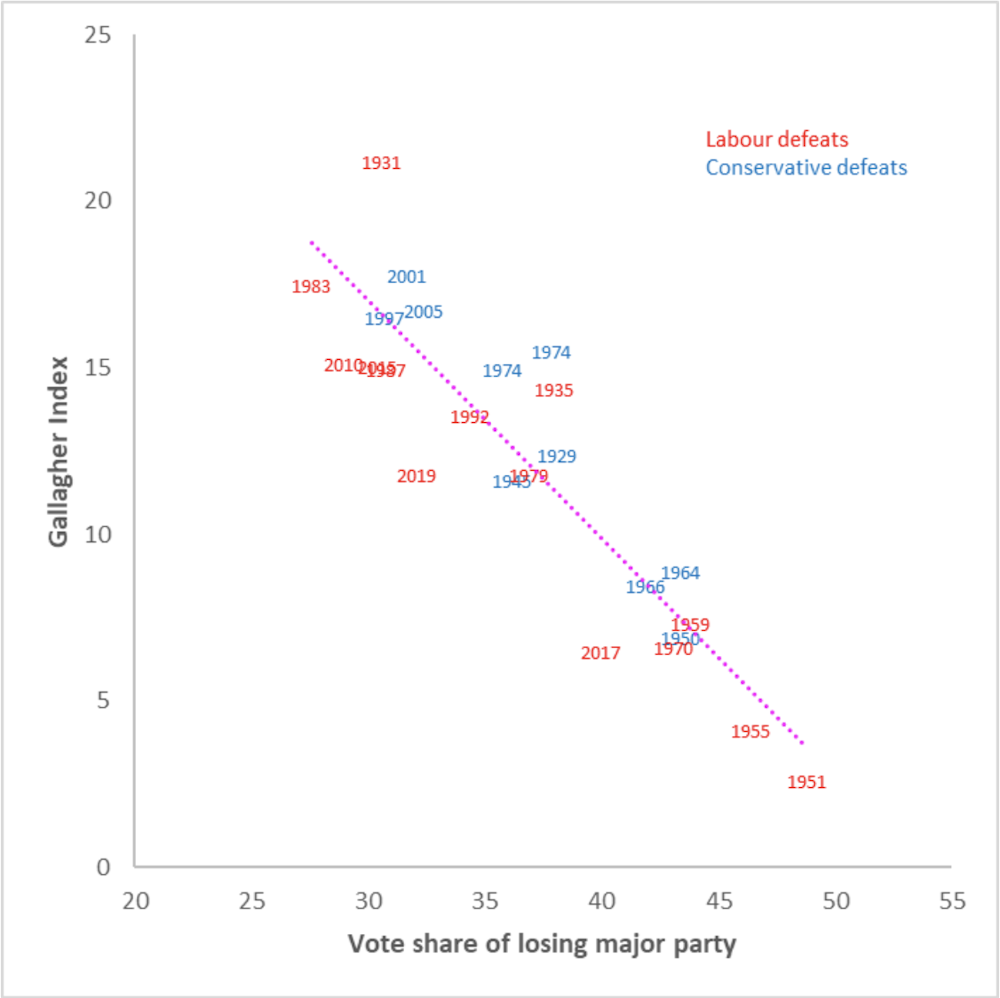
Looking at the vote shares of election losers between 1929 and 2019, there is an almost perfect correlation of -0.9 between the losing major party’s vote share and the proportionality of the election outcome. I’ve plotted the vote shares of the losers against the Gallagher index, which is the most widely used measure of proportionality. Higher values on the Gallagher index indicate more disproportionality.

Basically, as the losing party’s vote share approaches 50%, which is when we are witnessing a highly competitive two-horse race, FPTP can produce very proportional outcomes, with Gallagher index scores of sometimes below 5 (scores more typical in proportional representation systems). But as the losing major party’s vote share drops below 40%, Gallagher index scores get into double figures.
Why so disproportionate?
This is a very linear effect – the lower the vote share the second party gets, the more disproportionate the overall election result. The reason why this effect is so pervasive and why specifically the vote share of the second largest party is the best predictor of disproportionality is that declining vote shares of the second-largest party happen under two scenarios, both of which lead to distorted seat allocations.
The first scenario is when the party system fragments and more votes go to third parties. This was the case in all elections between 1983 and 2015. In these cases, FPTP proves to be a bad fit for multi-party politics.
The other scenario is a very asymmetric two-party race, where the second-largest party heavily trails the winner. This was the case in the election with the altogether most disproportionate outcome – the election of 1931, when Labour took 30% of the vote but ended up with just 8.5% of the seats in parliament.
The second scenario seems to create even more disproportionality than the first. That is borne out by the fact that the highest levels of disproportionality in elections across the world are regularly found in Caribbean countries, all of which inherited FPTP from their colonial past but have held on to much more rigid two-party systems than the UK. Whenever one party moves clearly ahead of the other, disproportionality reaches levels higher than ever witnessed in the UK. It has repeatedly even resulted in clean sweeps, where one party wins all the seats. The UK did come close to something akin to this once – in 2015, when when the SNP won 95% of Scottish seats on 50% of the vote.
Losing major party performance and disproportionality, UK 1929-2019
2024: a perfect storm
The UK’s current situation is a combination of the two scenarios. It is fragmented and there is significant asymmetry in the polling for the two main parties. The combined vote share of Labour and Conservatives looks to be dropping below 70% for the first time since 2015, while, at the same time, Labour have been leading the Conservatives by 15-20 percentage points throughout the last 18 months or so.
But the expected disproportionality in the upcoming election will be down to the Labour lead more than the degree of fragmentation.
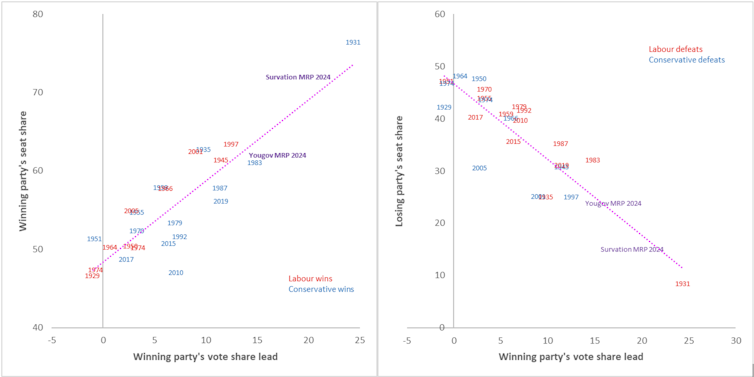
In the UK’s FPTP system, both major parties’ seat shares depend heavily on how much of a lead the winner has over the loser. The winner doesn’t need much of a lead to get a majority of seats but leads of over 10 percentage points give them super-majorities. Secure such a lead and you can expect seat shares of around 60%. This rises to 2/3 majorities when the party leads by above 15 points (which is very rare, but on the cards in this election).
Meanwhile, the loser drops to about a third of seats when 10 points behind. When it is over 15 points behind, it can expect just a quarter of seats and just 15% of seats when more than 20 points behind. And since this only depends on how far the loser trails behind and not on their own vote share, it means that the losing major party can get treated very badly by the electoral system when far behind.
The results of at least one of the two recent MRP polls have been questioned because of the dramatically high and low seat shares shown for Labour and the Conservatives. But my simple analysis here shows both of them fitting well with UK electoral history. The difference of an increase in the Labour lead by just a couple of points can change a lot under FPTP.
Winning margin and over-proportional seat gains and losses
For proponents of electoral reform, the upcoming election is set to provide a mixed bag. On one hand, a massive Labour win renders it unlikely that the party itself would contemplate reform. On the other, anything near a two-thirds majority for Labour on the back of a vote share barely above 40%, together with severe under-representation of the Conservatives, could expose the distorting nature of FPTP more than any election in living memory.