


Average income earners largely are the people who do get to take advantage of negative gearing - nurses, policemen and women on an average wage, investing, for instance, in a property. Most of them hold only one property, which adds to the housing stock that’s available for people as well. – Assistant Treasurer and Small Business Minister Kelly O'Dwyer, speaking on ABC TV’s Insiders, October 25, 2015
Negative gearing is a tax break available to people who own an investment property. This tax break applies only if the costs associated with the investment, including interest payments and other expenses, are greater than the rental income. Any loss made on the property can be offset against other income, thus reducing personal tax.
It’s true many nurses and police officers and other middle-income (and even much lower) people have negatively geared properties. But are these occupations and incomes the typical beneficiaries of negative gearing?
Checking the data
When asked for a source to support her statement, a spokesperson for O'Dwyer sent the following statistics.
• Taxation statistics show 66.5% of taxfilers who declare a net rental loss have a taxable income of A$80,000 or less.
• Those who use negative gearing include 22.6% of police officers, 19.2% of ambulance officers and paramedics, and 18.9% of train and tram drivers.
• Of the Australians who use negative gearing, the majority only hold one additional property.
• 73% of people with a rental property interest have only one property and 18% own two.
There is no set definition of the average income earner for Australia. If Kelly O’Dwyer is referring to the ABS’ average weekly earnings for full time employees in 2015 then she would be correct in asserting that most (around 66%) negatively geared investors have a taxable income below this level in 2012-13.
Although, it would also be true that around 84% of people without a rental property investment filing tax returns have a taxable income (in 2012-13) of less than $80,000 per annum. In other words, the vast majority of non-property investors have below average incomes.
Average weekly earnings for full time employees is not a good benchmark as income data is highly skewed by high income earners and many people don’t have full time employment.
Also, the latest taxation statistics showing actual taxable incomes (as sampled by the ATO) are for 2012-13, not 2015. It is the latest data we have got.
Incomes will have increased by around 10% since that taxation data was filed (wages increase by about 3% per year). It is also important to remember that the benefits of negative gearing are also greater for larger investments and higher marginal tax rates.
It is true that a relatively high proportion of the listed occupations have negatively geared properties. While it may be the popular belief that these are low or middle income occupations, these are actually reasonably highly paid occupations, compared to the median wage. For example, 73% of train and tram operators earn more than A$80,000 per year.
A different way to look at it is to analyse the income distribution of people who negatively gear compared to that of people who do not invest in rental properties.
The data set we used is called the 2012–13 individuals sample file. To collect this data, the Australian Taxation Office (ATO) sampled 2% of all individual tax returns filed in 2012-13.
According to this ATO data set, there are 1.26 million (10%) taxpayers who negatively gear. Their average loss was A$8,930 per year. A further 700,000 with a rental investment are positively geared (meaning their rental income was greater than their costs). About 85% of taxpayers don’t have a rental investment.

The chart shows what statisticians call the “smoothed” probability distribution (which is a smoothed histogram of the income distribution) of taxable income for people with negatively geared properties and people without rental investment properties. Marked also on the chart are the median and top 10% (P90) income points for both people with negatively geared properties and those without property investments.
The median income for negatively geared investors is A$60,000 per year, compared with $40,000 for non-investors.
A similar gap (50%) exists at the top end of the income spectrum. The taxable incomes of the top 10% of earners with negatively geared investments is around $150,000 compared to $98,000 for non-investors.
The chart shows clearly that, typically, people with negatively geared properties have significantly higher incomes than people without property investments.
In an April 2015 analysis commissioned by GetUp! for the Australia Institute, NATSEM found that 34% of the tax benefits of negative gearing accrues to the richest top 10% of families, as this chart from the report shows.
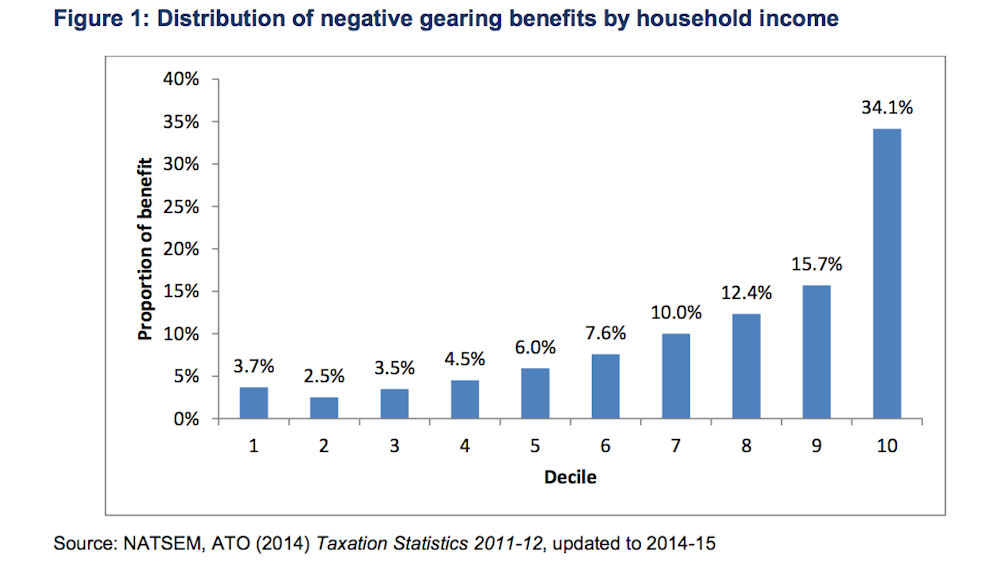
Only around 20% of the tax benefits go to the bottom half of the income distribution.
High-income families invest more money than low-income families. The tax system benefits high-income earners more than low-income earners due to higher marginal tax rates amplifying the effectiveness of deductions.
The role of capital gains
Negatively gearing property implies that the investor is making a loss on their investment. As the chart below shows, the tax savings are greatest among those in the higher tax brackets. However, it remains the case that these investors continue to make an overall loss on their investment, even after accounting for tax deductions.
The success of negative gearing as an investment strategy is reliant upon capital gains. In a property upswing, this strategy can be highly successful with lucrative gains on often minimal equity investment. During a property downswing or period of limited price growth, these strategies are very poor investments.
A recent analysis by the Grattan Institute shows that while police and nurses do invest in property, it is the higher-income occupations, such as doctors and mining engineers, who are much more likely to invest.
Adding to the housing stock?
Property investment only improves housing affordability when the purchase adds to the stock of newly constructed dwellings in affordable housing.
According to CoreLogic RP Data, in 2014 there were just under 500,000 property transactions and ABS building completions data suggest only around a third of those were newly built dwellings. It therefore stands to reason that most property transactions each year are probably existing stock.
Verdict
If Kelly O’Dwyer is referring to the ABS’ average weekly earnings for full time employees in 2015, then she would be correct in asserting that most (around 66%) negatively geared investors have a taxable income below this level in 2012-13.
However, ATO data shows that, typically, negatively geared investors have higher incomes than people without rental investments.
The same data shows that negatively geared investors have typical incomes around 50% higher than non-investors – even after deducting their losses from negative gearing.
The top 10% of the income distribution for negatively geared investors earn around 50% more than non-investors. Incomes for this top 10% are around $150,000 per year, compared with $98,000 for non-investors, according to the ATO. – Ben Phillips and Cukkoo Joseph
Review
While I agree with everything in the above FactCheck, I would go further in criticising Kelly O'Dwyer’s statement, particularly the reference to investors adding to the housing stock.
The figure cited above for the ratio of housing purchases for new housing stock includes owner occupiers.
The impact on housing stock is tiny, but the effect on housing affordability of all those investors bidding up the prices of existing housing is likely to be substantial.– Warwick Smith
CORRECTION AND CLARIFICATION: This article was corrected after publication on November 24 to acknowledge the fact that if Kelly O’Dwyer is referring to the ABS’ average weekly earnings for full time employees in 2015, then she would be correct in asserting that most (around 66%) negatively geared investors have a taxable income below this level in 2012-13. This change involved alteration to a number of paragraphs. You can read more about the correction and clarification here.