

As heads of state gather in New York for tomorrow’s United Nations climate summit, a new report on the state of the world’s carbon budget tells them that greenhouse emissions hit a new record last year, and are still growing.
The Global Carbon Project has released its annual report card on the global and national trends in carbon dioxide (CO2) emissions.
It shows that global emissions from burning fossil fuels and cement production reached a new record of 36 billion tonnes of CO2 in 2013, and are predicted to grow by a further 2.5% in 2014, bringing the total CO2 emissions from all sources to more than 40 billion tonnes. This is about 65% more fossil-fuel emission than in 1990, when international negotiations to reduce emissions to address climate change began.
Meanwhile, deforestation now accounts for just 8% of total emissions, a fraction that has been declining for several decades.
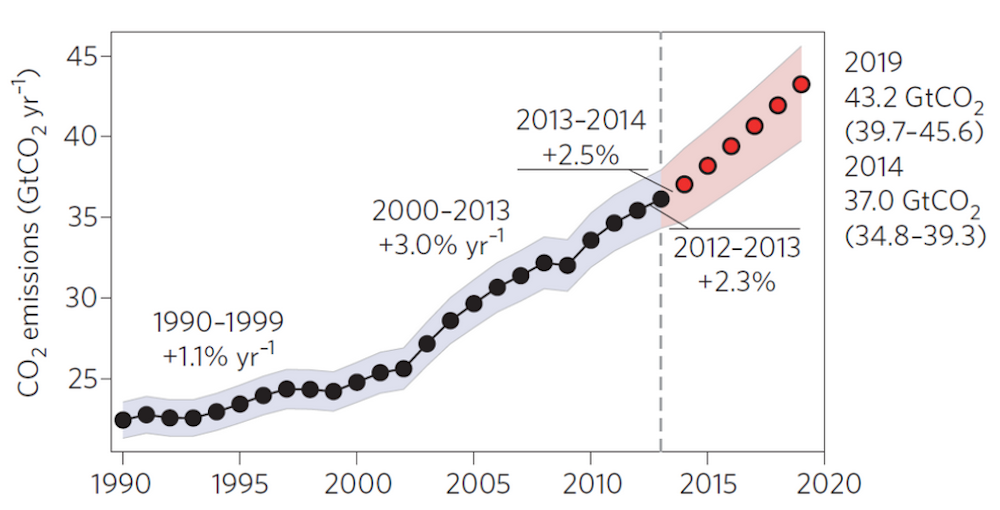
The growth of global emissions since 2009 has been slower than in the prior period of 2000-08. However, projections based on forecast growth in global gross domestic product (GDP) and continuance of improving trends in carbon intensity (emissions per unit of GDP) suggest a continuation of rapid emissions growth over the coming five years.
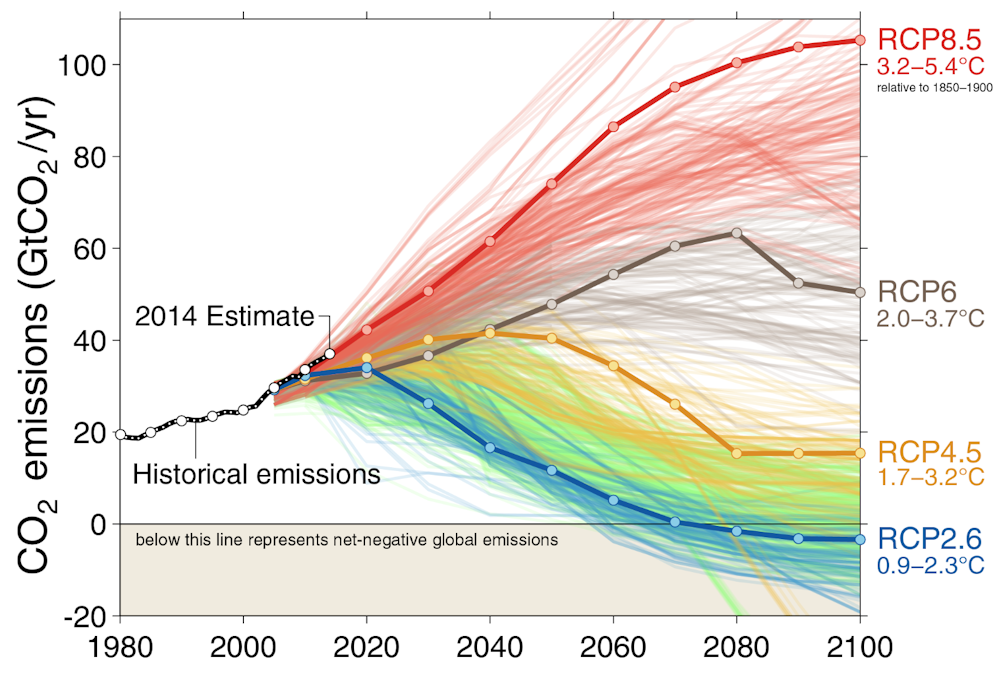
Global emissions continue to track the most carbon-intensive range among more than a thousand scenarios developed by the Intergovernmental Panel on Climate Change (IPCC). If continued, this situation would lead to global average temperatures between 3.2C and 5.4C above pre-industrial levels by 2100.
There have been other striking changes in emissions profiles since climate negotiations began. In 1990, about two-thirds of CO2 emissions came from developed countries including the United States, Japan, Russia and the European Union (EU) nations. Today, only one-third of world emissions are from these countries; the rest come from the emerging economies and less-developed countries that account for 80% of the global population, suggesting a large potential further emissions growth.
Continuation of current trends over the next five years alone will lead to a new world order on greenhouse gas emissions, with China emitting as much as the United States, Europe and India together.
Country emission profiles
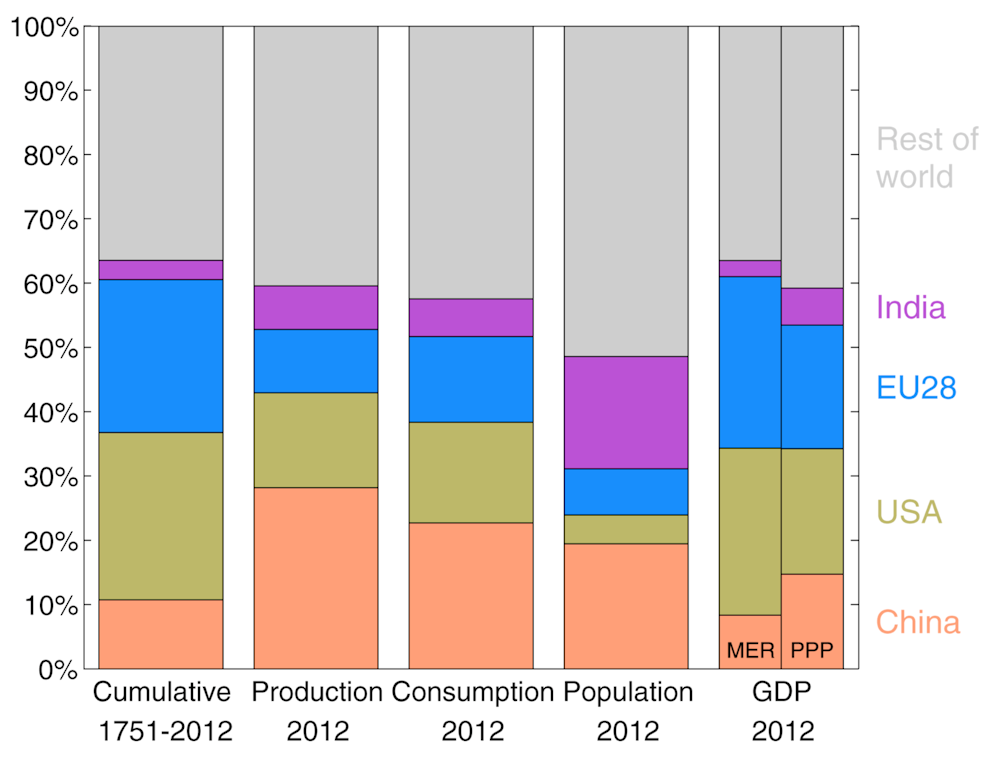
There are several ways to explore countries’ respective contributions to climate change. These include current emissions, per capita emissions, and cumulative emissions since the industrial revolution.
The largest emitters in 2013 were China, the United States, the 28 EU countries (considered as a single bloc), and India. Together, they account for 58% of global emissions and 80% of the emissions growth in 2013 (with the majority the growth coming from China, whereas the EU cut its emissions overall).
Here’s how the major emitters fared in 2013.
China
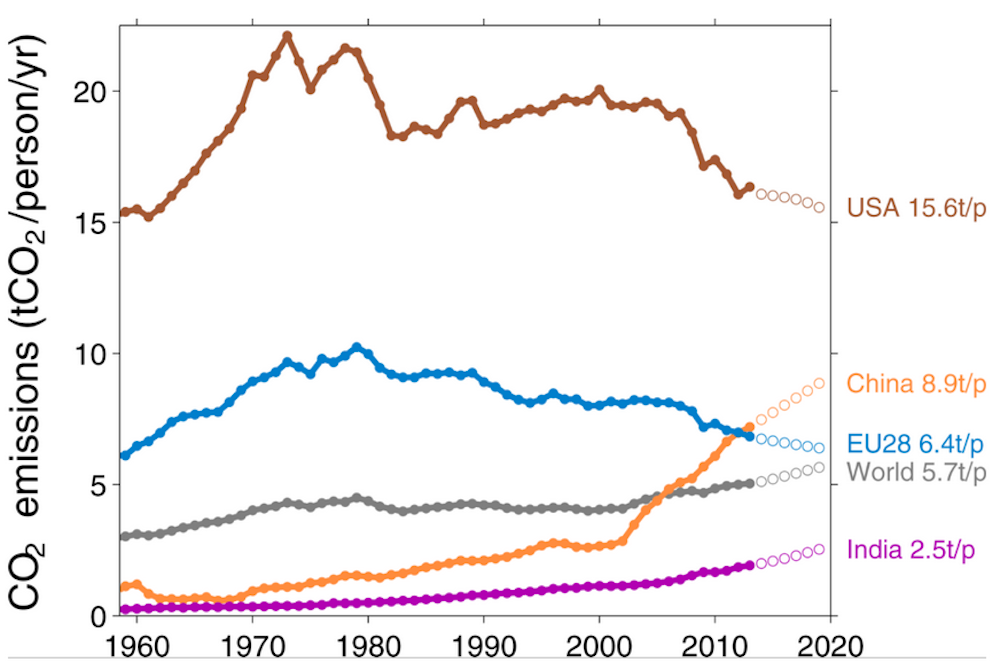
Emissions grew at 4.2%, the lowest level since the 2008 global financial crisis, because of weaker economic growth and improvements in the carbon intensity of the economy. Per capita emissions in China (7.2 tonnes of CO2 per person) overtook those in Europe (6.8 tonnes per person).
A large part of China’s high per capita emissions is due to industries that provide services and products to the developed world, not for China’s domestic use. China’s cumulative emissions are still only 11% of the total since pre-industrial times.
United States
Emissions increased by 2.9% because of a rebound in coal consumption, reversing a declining trend in emissions since 2008. Emissions are projected to remain steady until 2019 in the absence of more stringent climate policies, with improvements in the energy and carbon intensity of the economy being offset by growth in GDP and population. The United States remains the biggest contributor of cumulative emissions with 26% of the total.
European Union
Emissions fell by 1.8% on the back of a weak economy, although reductions in some countries were offset by a return to coal led by Poland, Germany and Finland. However, the long-term decrease in EU emissions does not factor in the emissions linked to imported goods and services. When accounting for these “consumption” emissions, EU emissions have merely stabilised, rather than decreased.
India
Emissions grew by 5.1%, driven by robust economic growth and an increase in the carbon intensity of the economy. Per capita emissions were still well below the global average, at 1.9 tonnes of CO2 per person, although India’s total emissions are projected to overtake those in the EU by 2019 (albeit for a population nearly three times as large). Cumulative emissions account for only 3% of the total.
Australia
Emissions from fossil fuels declined in 2013, largely driven by a 5% decline of emissions in the electricity sector over the previous year (as shown by the Australian National Greenhouse Gas Accounts). Fossil fuel emissions per person remain high at 14.6 tonnes of CO2.

Is it too late to tame the climate?
Our estimates (see here and here) show that, at current emissions levels, average global warming will hit 2C in about 30 years.
Despite this apparently imminent event, economic models can still come up with scenarios in which global warming is kept within 2C by 2100, while both population and per capita wealth continue to grow. Are these models playing tricks on us?
Most models invoke two things that will be crucial to stabilising the climate at safer levels. The first is immediate global action to develop carbon markets, with prices rapidly growing to over US$100 per tonne of CO2.
The second is the deployment of “negative emissions” technologies during the second half of this century, which will be needed to mop up the overshoot of emissions between now and mid-century. This will involve removing CO2 from the atmosphere and storing it in safe places such as saline aquifers.
These technologies are largely unavailable at present. The most likely candidate is the production of bioenergy with carbon capture and storage, a combination of existing technologies with high costs and with environmental and socio-economic implications that are untested at the required scales.
There are no easy pathways to climate stabilization, and certainly no magic bullets. It is still open to us to choose whether we halt our CO2 emissions completely this century – as required for a safe, stable climate – or try instead to adapt to significantly greater impacts of climate change.
What we have no choice about is the fact that the longer emissions continue to grow at rates of 2% per year or more, the harder it will be to tame our climate.
The lead image on this article was changed on September 23, 2014, to illustrate coal production. The previous image depicted a coal-fired power station.