

If you’re not a die-hard numbers person, government statistics can often go right over your head. That is, unless the data is easy to access and directly speaks to your everyday life.
A new online service from the UK’s Office for National Statistics (ONS) aims to facilitate just that. Launched in March 2024, the Explore Local Statistics service collates 57 local measurements, across topics ranging from health and school results to smoking and income levels.
You simply input your postcode or the name of an area you are thinking of moving to, say, and you can explore, download and map all kinds of statistics that tell you something about what living there is like.
The ONS has highlighted that data published by public bodies is often difficult to access for officials, let alone ordinary residents who are simply curious about their local areas. This new service, by contrast, makes it easy.
Geographical inequalities
What do Kingston upon Hull, a port city towards the north of England, and Worthing, a 270 mile drive to the south, have in common? The ONS tool will tell you that, among all UK local authorities, they share the highest percentages of premises with very fast broadband speeds.
Torbay and Blackpool, meanwhile, two westerly coastal locations separated by the whole of Wales, rank among the highest in terms of truancy.
Such comparisons quickly highlight long-standing geographical inequalities across the social and economic landscape of the UK. The average worker in Wandsworth, a borough in south-west London, gets paid almost double that of a worker in West Devon.
The average male born in Rutland, in the east Midlands, between 2018-2019, is anticipated to live 74.7 years. In Blackpool, that figure drops to a shocking 53.5 years.
In the east London borough of Tower Hamlets, male life expectancy increased by 11 years from 2011-13, perhaps through gentrification and the displacement of traditional communities.
But in places including Warwickshire, in the west Midlands and North East Lincolnshire, it is falling. This chimes with research showing that life expectancy is generally declining in the UK but there are large geographical variations in how long people are expected to live.
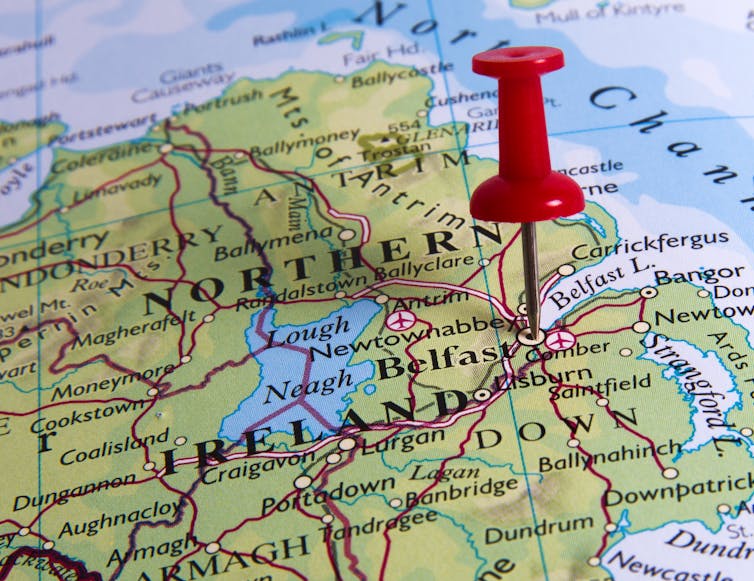
More broadly, the service allows comparisons between the UK’s four nations.Homicide rates are 30% greater in England than they are in Wales (10.3 homicides per 1 million people recorded in England in 2020-23; 7.9 in Wales). The 2022-23 economic inactivity rate (percentage of people aged 16 to 64 who are not in employment and are not actively seeking work) is greatest in Northern Ireland (25.0), followed by Wales (22.9), Scotland (22.1) and England (21.1).

What the data does not show
One useful feature is the ability to compare like with like. A local politician, for instance, might explore how their area is performing relative to others that are demographically or geographically close.
The estimated gross disposable income in Bradford, in the north of England, is about 25% lower than the average for all local authorities in the UK. That average, however, includes London’s most wealthy areas – the City of London, Kensington and Chelsea, Westminster…
Comparing Bradford with the super-rich is arguably not as meaningful as comparing Bradford with local authorities in the UK’s industrial heartlands – the Scottish Lowlands, the north-east of England, Greater Manchester, Yorkshire, south Wales – which the ONS describe as low-ranking in terms of healthy life expectancy, domestic electricity consumption and educational qualifications and high-ranking in the proportion of children in relative poverty.
Yet even among this group, income in Bradford is low. It is also low for Yorkshire and the Humber, the region in which Bradford is located. This reveals both regional and sub-regional inequalities.
Generally, opening up access to data is a good idea. It allows a wider range of people to access information that can be useful to them personally, politically and commercially. But a few notes of caution are warranted.
First, not all ONS data is presently available at a detailed, geographic level.
The service offers links to tools for obtaining and mapping neighbourhood-level Census 2021 data for England and Wales. But, for the 57 local indicators it collates, the data appears only to be available for local authorities, regions or countries. Devolution means it is also quite often limited to England.
The problem with local authority data is it conceals internal social, economic and geographic variations. The average disposable income in Kensington and Chelsea, for example, is reported to be £90,971 per person. That figure belies the huge inequality and deprivation within that London borough.
Second, not all geographical variation is meaningful. If you click here and change the default map to “Countries”, Northern Ireland will appear to be the happiest nation, followed by Scotland, England and Wales. However, the actual numbers (shown in the table below the map) show the differences between the nations are trivial. In fact, all but Northern Ireland have the same value. The map thus suggests differences that do not really exist.
Third, direct comparison between places is not always appropriate because geographical areas can vary greatly in physical and population size. Birmingham has the highest count of businesses ceasing activity. The Isles of Scilly, located off the coast of south-west England, have the least. Birmingham also has the highest number of business births. In this case, the Orkney Islands, in Scotland, have the least.
You might assume that these statistics relate to the local economy, entrepreneurism or innovation. But there is a simpler explanation: Birmingham is more populous than any other local authority in the UK (its Census 2021 population was over 1.14 million; the next largest in England and Wales, is Leeds, at about 812,000). More residents means more opportunity for businesses to open and close.
Fourth, much of the data is available on an annual or similar basis. This can be very useful for studying changes over time. But, be careful. Did the percentage of adults who smoke traditional (not e-) cigarettes really more than double in Mid Devon over one year, from 10.8 in 2021 to 25.1 in 2022? It’s unlikely. It is more likely due to a change in the estimation method.
This service is a good first step towards a one-stop shop for easy access to subnational statistics to understand local areas and how they’re changing. More granular data about local neighbourhoods, in the way a service like StreetCheck provides, would make it better.