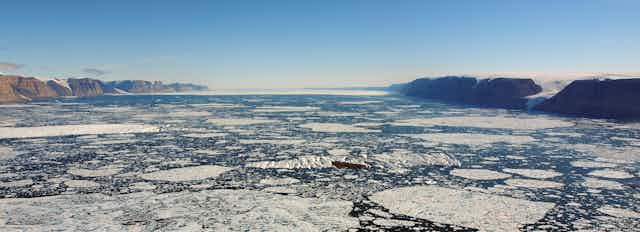

Understanding how glaciers interact with the ocean is akin to piecing together a colossal jigsaw puzzle. And on various icebreaker expeditions to some of the most remote fjords in northern Greenland, colleagues and I have showed that the shape of the seafloor is one of the key pieces of that puzzle.
To understand why the seabed is so important, we have to look at the glaciers themselves and what is causing them to retreat or even disappear. The large glaciers that meet the ocean in Greenland and Antarctica balance their mass over time largely in pace with the climate. When it snows or rains they accumulate ice, and they lose ice to melting and calving – the process where chunks of ice break off and eventually melt away into the sea.
But over the past few decades they are losing mass at an accelerated pace, with more icebergs calving into the ocean and more ice being melted from below by relatively warm seawater.
Estimating how much mass will be lost is often highlighted as glaciology’s grand challenge as it constitutes a large uncertainty in our predictions of future sea-level rise. To hone our predictions, it is crucial to find the areas where warmer ocean water reaches the these glaciers.
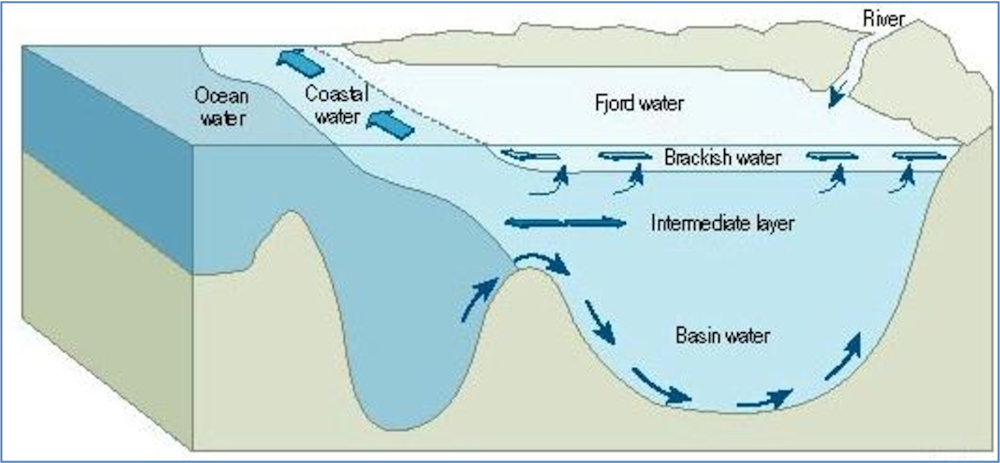
Most glaciers in Greenland drain into fjords in which the waters near the surface are very cold, heavily influenced by meltwater from the glaciers. Some fjords also allow in warmer water of Atlantic origin, which is saltier and therefore heavier so it enters the fjords at a greater depth.
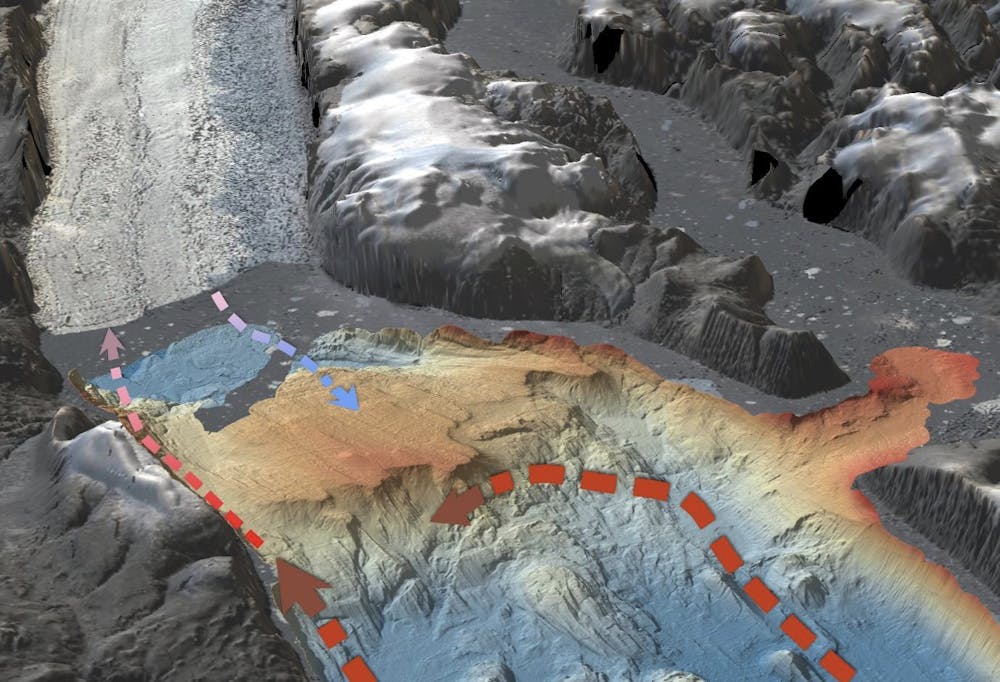
The shape and depth (or “bathymetry”) of the seafloor determines whether this warmer water can reach the glaciers and cause them to melt. These fjords may have particularly complex bathymetry as they themselves were formed by glaciers which also eroded the seabed. While the inner parts can be a kilometre deep, a shallower “sill” at the entrance (formed when eroded materials accumulate or from resistant bedrock) can act as a shield against inflowing warmer water.
That’s why mapping these fjords is one of the most critical steps in assessing the future of the glaciers that flow into them. This is unfortunately easier said than done, since many of these glaciers flow into some of the most remote areas of the world.
Ireland-sized glacier, Manhattan-sized icebergs
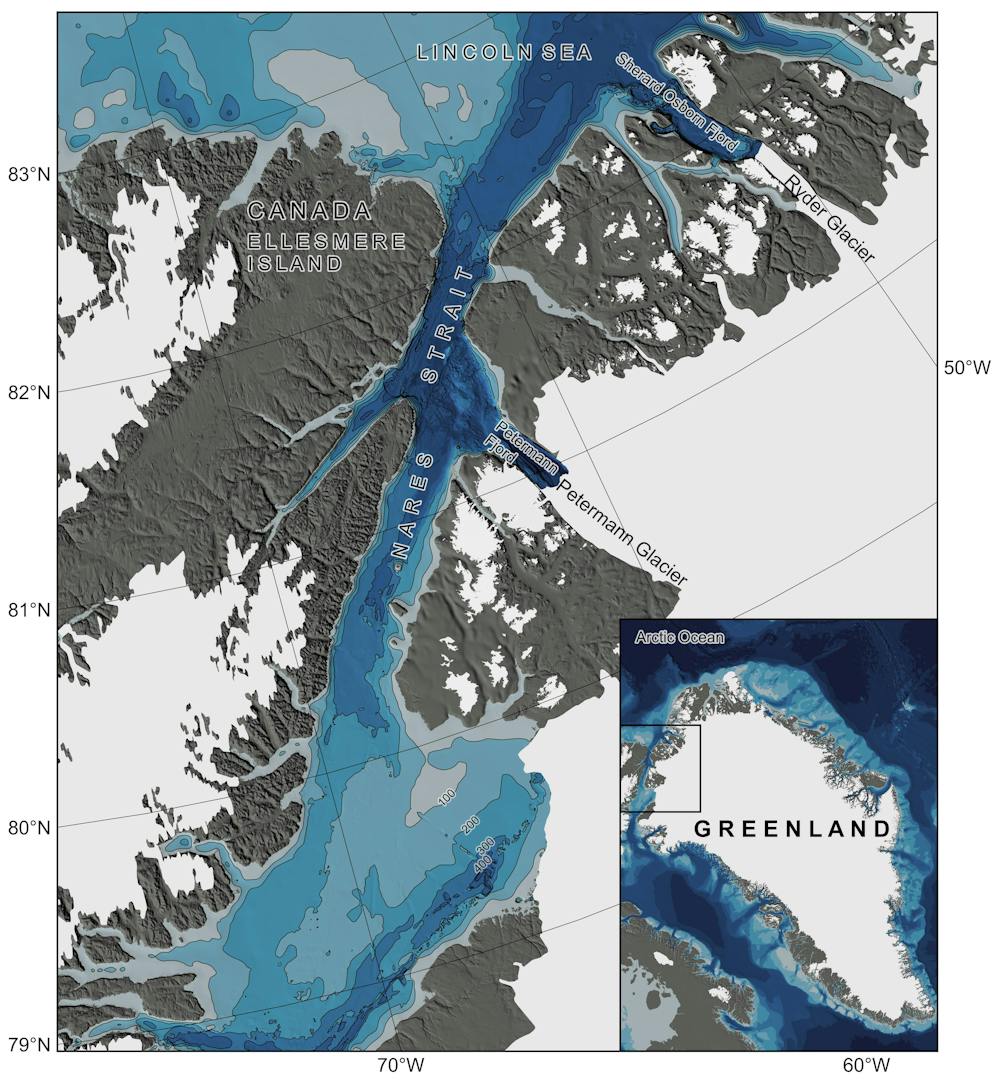
The Petermann Glacier – the largest in the northern part of the Greenland ice sheet – drains an area of about 74,000 square kilometres, similar to the size of Ireland.
Petermann is one of a few glaciers around Greenland with a floating ice tongue extending tens of kilometres from where the glacier is grounded on the seafloor. These ice tongues may act as a brakes on the flow of ice into the sea, slowing down mass loss.
In 2010, Petermann made headlines when a huge chunk broke off and formed an iceberg four times the size of Manhattan island. This was followed by another huge calving two years later. While calving is a natural process, these unusually large events were likely influenced by warmer waters from the Atlantic melting the tongue from below, making it thinner and more prone to break.
In 2015 colleagues and I mapped the entire seabed of Petermann Fjord for the first time. We found the entrance was still very deep: 443 metres – as deep as the Empire State Building is tall. Deep enough for that warm, heavy, salty glacier-melting Atlantic water to enter.

We next wanted to compare Petermann to the Ryder Glacier to its northeast, which has been more stable since at least the 1950s. Was it kept in place by a shallow fjord entrance keeping out warmer water?
At the time, no ship had ever entered Sherard Osborn Fjord where Ryder Glacier drains, because the sea ice in that region is the toughest in the entire Arctic Ocean. Therefore, nothing at all was known about the seafloor. Ryder Glacier became the target for our next expedition with icebreaker Oden in 2019.
Shielded from warmer water
Thick ice in the narrow passage separating Ellesmere Island from Greenland made it hard to even get to Sherard Osborn Fjord. And entering the fjord was a true challenge, as large icebergs that had calved from the ice tongue floated around and occasionally blocked the entire entrance.
It turned out the fjord has a prominent shallow sill in front of Ryder Glacier. This sill shields the glacier from warmer subsurface Atlantic water, which appears to explain why it has behaved very differently compared to Petermann.
The bathymetry of both Petermann and Sherard Osborn fjords has now been incorporated into the Seabed 2030 Project, which aims to completely map the world’s ocean floor before the end of the decade. Knowing more about the seabed, and the glaciers that flow into the sea, will in turn help us to sustainably manage the ocean and, ultimately, the planet.
The are more completely unmapped areas in North Greenland. In 2024, we are planning another expedition with icebreaker Oden even further north to Victoria Fjord, where C.H. Ostenfeld Glacier drains. This glacier recently lost its floating ice tongue and whether or not Atlantic water makes into the fjord remains to be seen.

Don’t have time to read about climate change as much as you’d like?
Get a weekly roundup in your inbox instead. Every Wednesday, The Conversation’s environment editor writes Imagine, a short email that goes a little deeper into just one climate issue. Join the 20,000+ readers who’ve subscribed so far.