
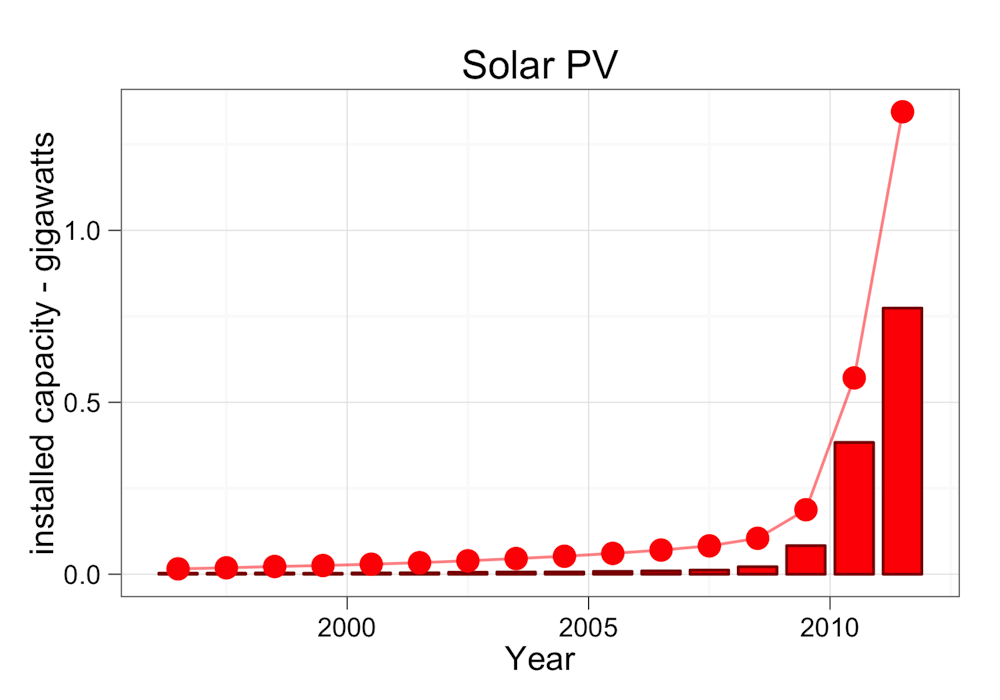
The recent take-up of domestic solar photo-voltaic (PV) panels in Australia has been quite phenomenal. Across 2010 and 2011, the installed capacity increased seven fold to about 1.4 gigawatts, doubling every 9 months.
By the end of this year we will probably have in excess of 2 gigawatts of solar PV capacity installed. All fired up at the same time it is enough to produce about 8% of the average daytime electricity demand.
Of course, a characteristic of solar PV is that it doesn’t fire up for much of the time at all. With a capacity factor of about 18%, 2 gigawatts capacity would be expected to output an average of no more than 360 megawatts or about 1.5% of our average demand. At those levels you might ask if solar PV is having any impact on our demand for mains electricity.
Judging by the numbers, the answer is a definitive “yes”. In fact, so much so that it wouldn’t surprise if it is beginning to worry some utility managers.
Since solar PV production rises and falls in a characteristic pattern through the daylight hours, any substantive impact should be evident in a distinct reduction in demand for mains electricity in the middle of the day. With PV penetration having risen so dramatically since 2009, that pattern should be apparent in comparisons of demand over the last 12 months with equivalent periods prior to 2009.
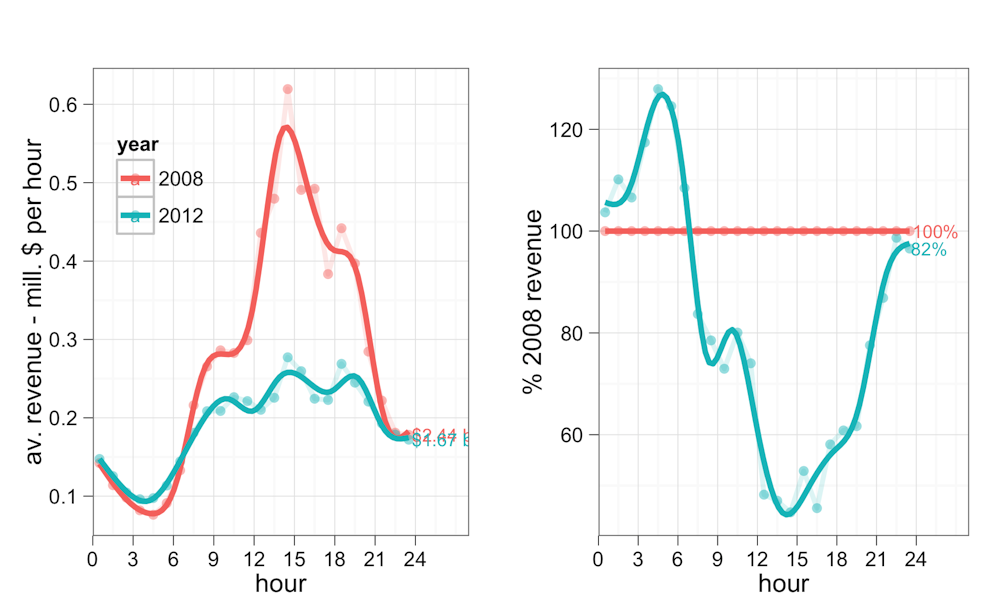
In fact when we do this, the PV signature is blindingly obvious, especially in the states of South Australia and Queensland where PV penetration is highest. It is also showing itself in the revenues generated by electricity sold on the wholesale market.
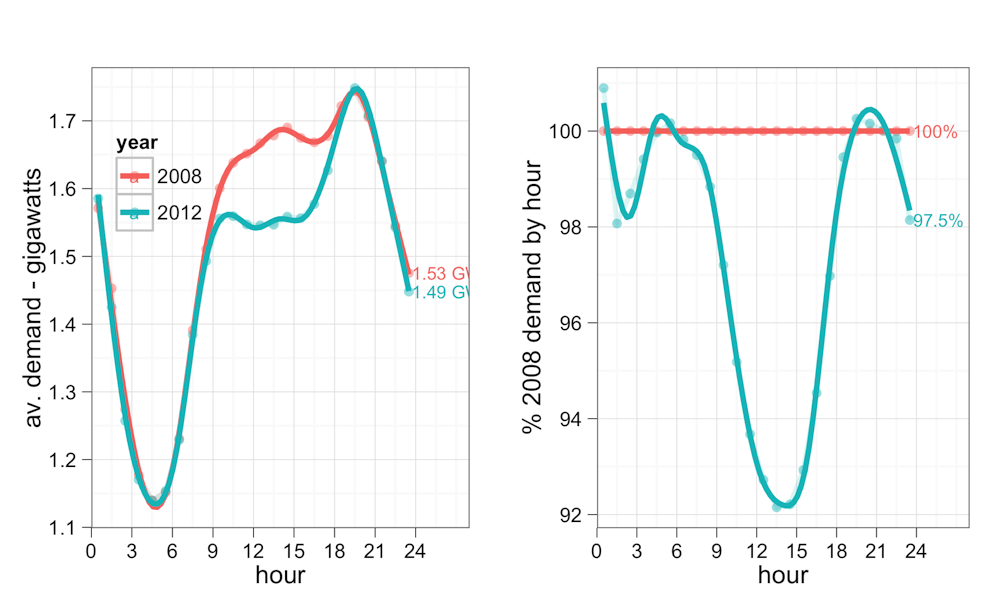
In South Australia, midday to early afternoon demand was down over the financial year 2011-12 by about 8% on the average for the period spanning mid- 2007 through mid-2009. That contrasted with a negligible change in demand outside daylight hours.
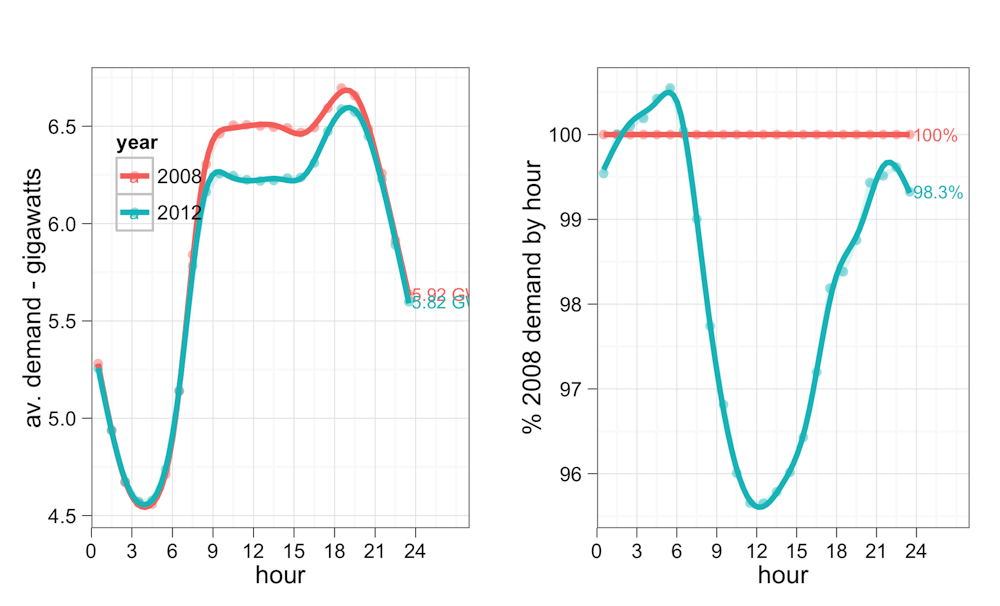
In Queensland the story is very similar, although the proportional impact is lower with midday 2011-12 demand down only about 4% on 2007-09 levels.
Given the extent to which PV has been rolled out in the last few years, the characteristic signature of demand reduction in the middle of the day is not particularly surprising. What is more interesting is the signature of PV penetration in the wholesale electricity market.
As pointed out in this column a few weeks back, demand reduction is creating oversupply in the wholesale electricity market and causing prices to collapse.
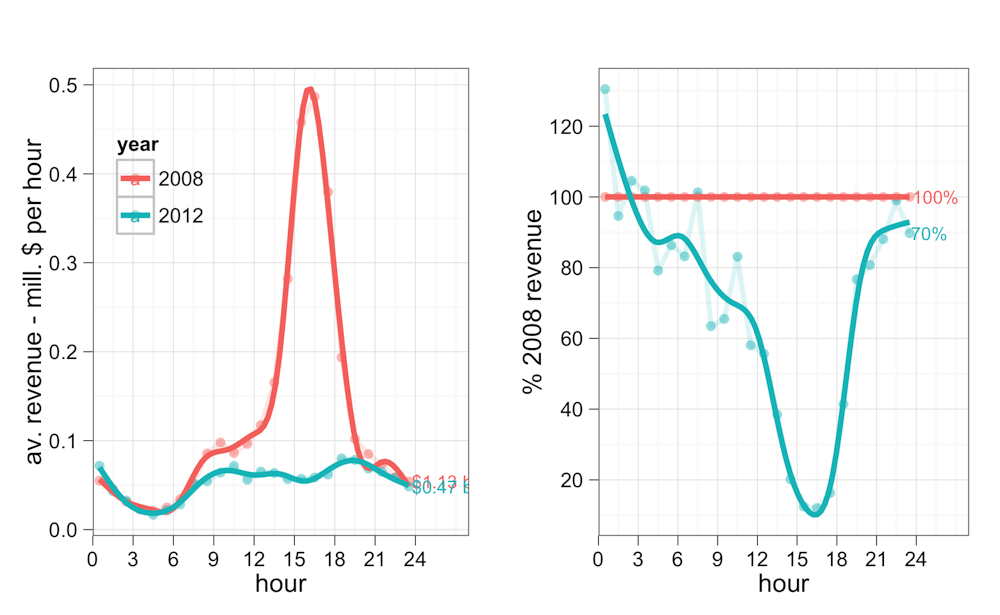
And it is the afternoon and early evening when the wholesale market makes its money, because that is when demand is highest. So any decline in demand in the afternoon will take much of the cream out of the market.
In the period prior to significant PV penetration, hourly revenues on the South Australian wholesale market typically peaked at 3-4 pm in the afternoon at 5 times above base revenues. By 2011-12 those peaks were gone. Even though PV generation is tailing off significantly by 4 pm, the demand reduction was still enough to reduce peak hourly revenues by almost 90% between 2007-09 and 2011-12, contributing to a 30% decline in the annual wholesale revenue.
In Queensland, 2011-12 midday revenues were down 50% on 2007-09 averages, contributing to an annual revenue fall of about 18%.
Across the National Electricity Market, 2011-12 revenues were down 35%, or some $3.3 billion, on the annual $9.6 billion for the two years prior to mid-2009.
These represent massive impacts on the business of electricity. With PV being a major causal factor, things are are only likely to get worse if solar PV deployment continues at the recent frenetic pace.
It will only take several more doublings in capacity, or about 18 months if recent history is any guide, to reduce midday demand to current midnight levels. That would render the midday to early afternoon period akin to the current overnight ‘off-peak’. In such a scenario, the window of opportunity for healthy margin on mains electricity supply will shrink to just a few hours during the evening peak. With that need best supplied by gas “peakers” such a scenario must be making for some anxiety amongst the managers of our base-load coal generation fleet.
In such a scenario, the cost of delivering mains power will have to rise. That is because while the distribution network needs to be scaled to the size of peak demand, it recoups investment over the total amount of electricity supplied through day and night. With solar PV biting into the daytime demand but barely shaving peak demand, the unit cost of distribution will inevitably rise. Distribution is already the major factor in retail electricity prices.
The problematic feedback is evident. Rising retail prices will further incentivise take up of domestic PV, which in turn drives retail prices even higher. Meanwhile, further deployment of PV helps reduce its costs making it even more attractive, and so on ad infinitum, at least until most household roofs are covered.
A potential nightmare facing the mains electricity industry has recently been acknowledged by the AGL economists Paul Simshauser and Tim Nelson in their paper “[The Energy Market Death Spiral - Rethinking Customer Hardship](http://www.aglblog.com.au/wp-content/uploads/2012/07/No-31-Death-Spiral1.pdf](http://www.aglblog.com.au/wp-content/uploads/2012/07/No-31-Death-Spiral1.pdf)”. In that paper the “death spiral” scenario for the Australian power industry is framed by a quote from a US study by Craig Severance.
‘The unspoken fear of all utility managers is the “Death Spiral Scenario”. In this nightmare, a utility commits to build new equipment. However, when electric rates are raised to pay for the new plant, the rate shock moves customers to cut their kWh use. The utility then raises its rates even higher – causing a further spiral as customers cut their use even more… In the final stages of that death spiral, the more affluent customers drastically cut purchases by implementing efficiency and on-site power, but the poorest customers have been unable to finance such measures…’
It is not hard to imagine how utility managers here in Australia are worrying about just how PV is going to impact their business.