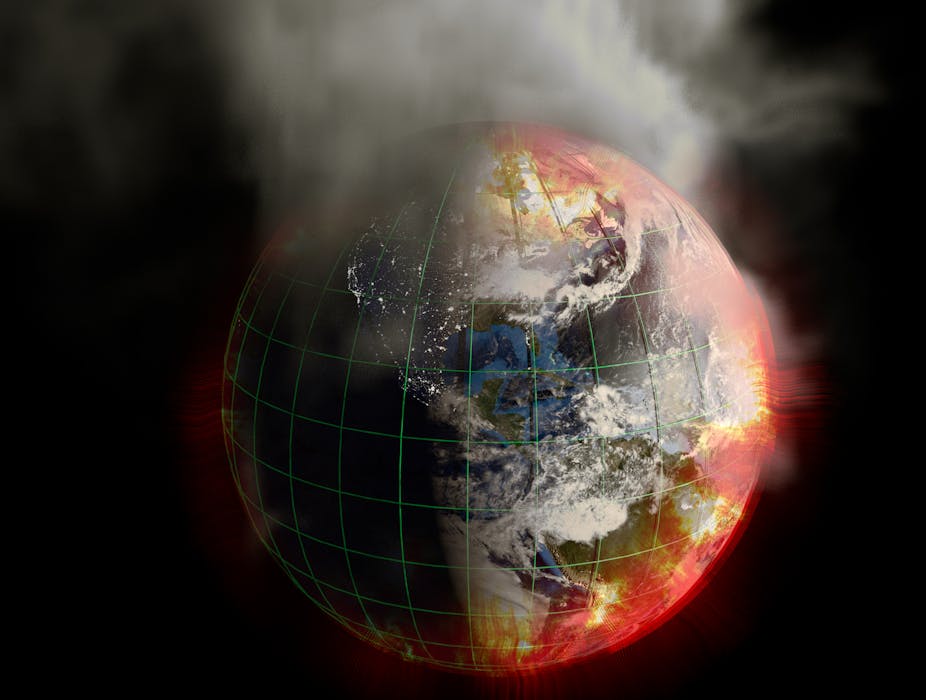
It’s long been known that massive increases in emission of CO2 from volcanoes, associated with the opening of the Atlantic Ocean in the end-Triassic Period, set off a shift in state of the climate which caused global mass extinction of species, eliminating about 34% of genera. The extinction created ecological niches which allowed the rise of dinosaurs during the Triassic, about 250-200 million years ago.
New research released this morning in Science Express has refined the dating of this wave of volcanism. It shows marine and land species disappear from the fossil record within 20,000 to 30,000 years from the time evidence for the eruption of large magma flows appears, approximately 201 million years ago. These volcanic eruptions increased atmospheric CO2 and increased ocean acidity.
Mass extinctions due to rapidly escalating levels of CO2 are recorded since as long as 580 million years ago. As our anthropogenic global emissions of CO2 are rising, at a rate for which no precedence is known from the geological record with the exception of asteroid impacts, another wave of extinctions is unfolding.
Mass extinctions of species in the history of Earth include:
- the ~580 million years-old (Ma) Acraman impact (South Australia) and Acrytarch (ancient palynomorphs) extinction and radiation
- Late Devonian (~374 Ma) volcanism, peak global temperatures and mass extinctions
- the end-Devonian impact cluster associated with mass extinction, which among others destroyed the Kimberley Fitzroy reefs (~360 Ma)
- the upper Permian (~267 Ma) extinction associated with a warming trend
- the Permian-Triassic boundary volcanic and asteroid impact events (~ 251 Ma) and peak warming
- the End-Triassic (201 Ma) opening of the Atlantic Ocean, and massive volcanism
- an End-Jurassic (~145 Ma) impact cluster and opening of the Indian Ocean
- the Cretaceous-Tertiary boundary (K-T) (~65 Ma) impact cluster, Deccan volcanic activity and mass extinction
- the pre-Eocene-Oligocene boundary (~34 Ma) impact cluster and a cooling trend, followed by opening of the Drake Passage between Antarctica and South America, formation of the Antarctic ice sheet and minor extinction at ~34 Ma.
Throughout the Phanerozoic (from 542 million years ago), major mass extinctions of species closely coincided with abrupt rises of atmospheric carbon dioxide and ocean acidity. These increases took place at rates to which many species could not adapt. These events - triggered by asteroid impacts, massive volcanic activity, eruption of methane, ocean anoxia and extreme rates of glaciation (see Figures 1 and 2) - have direct implications for the effects of the current rise of CO2.


In February 2013, CO2 levels had risen to near 396.80ppm at Mauna Loa Atmospheric Observatory, compared to 393.54ppm in February 2012. This rise - 3.26ppm per year - is at the highest rate yet recorded. Further measurements show CO2 is at near 400ppm of the atmosphere over the Arctic. At this rate the upper stability threshold of the Antarctic ice sheet, defined at about 500–600ppm CO2 would be reached later this century (although hysteresis of the ice sheets may slow down melting).
Our global carbon reserves - including coal, oil, oil shale, tar sands, gas and coal-seam gas - contain considerably more than 10,000 billion tonnes of carbon (see Figure 5). This amount of carbon, if released into the atmosphere, is capable of raising atmospheric CO2 levels to higher than 1000ppm. Such a rise in atmospheric radiative forcing will be similar to that of the Paleocene-Eocene boundary thermal maximum (PETM), which happened about 55 million years-ago (see Figures 1, 2 and 4). But the rate of rise surpasses those of this thermal maximum by about ten times.


The Paleocene-Eocene boundary thermal maximum event about 55 million years ago saw the release of approximately 2000 to 3000 billion tons of carbon to the atmosphere in the form of methane (CH4). It led to the extinction of about 35-50% of benthic foraminifera (see Figure 3 and 4), representing a major decline in the state of the marine ecosystem. The temperature rise and ocean acidity during this event are shown in Figures 4 and 6.
Based on the amount of carbon already emitted and which could continue to be released to the atmosphere (see Figure 5), current climate trends could be tracking toward conditions like those of the Paleocene-Eocene event. Many species may be unable to adapt to the extreme rate of current rise in greenhouse gases and temperatures. The rapid opening of the Arctic Sea ice, melting of Greenland and west Antarctic ice sheets, and rising spate of floods, heat waves, fires and other extreme weather events may signify a shift in state of the climate, crossing tipping points.

By analogy to medical science analysing blood count as diagnosis for cancer, climate science uses the greenhouse gas levels of the atmosphere, pH levels of the ocean, variations in solar insolation, aerosol concentrations, clouding states at different levels of the atmosphere, state of the continental ice sheets and sea ice, position of high pressure ridges and climate zones and many other parameters to determine trends in the climate. The results of these tests, conducted by thousands of peer-reviewed scientists world-wide, have to date been ignored, at the greatest peril to humanity and nature.
Continuing emissions contravene international laws regarding crimes against humanity and related International and Australian covenants. In the absence of an effective global mitigation effort, governments world-wide are now presiding over the demise of future generations and of nature, tracking toward one of the greatest mass extinction events nature has seen. It is time we learned from the history of planet Earth.


