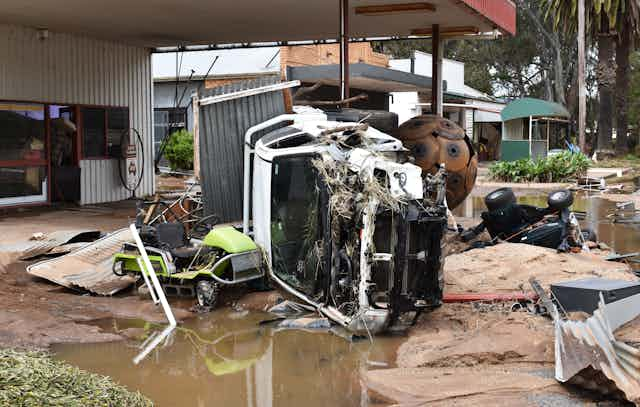

On Monday, residents of Eugowra in New South Wales had to flee for their lives. They had only minutes to get to higher ground – or their rooftops – to escape what’s been dubbed an “inland tsunami” of water. This week, many other towns across western NSW faced renewed floods. For many people affected, the real shock is how unexpected it was – and how fast the water came. Their houses and land had never flooded, as far as they knew. What had changed?
This is an important question with a number of answers. When we make these assessments, we’re drawing on two sources: local knowledge and, increasingly, what flood maps tell us.
While tremendously useful, local knowledge has limits. Human memory is fallible and written records do not stretch back far. Flood maps also have constraints. That’s because floods can differ greatly depending on where the rain falls, at what intensity, and over what period of time. We will also have to redraw flood maps more often, as climate change brings more extreme weather. As climate change progresses, the atmosphere can hold more water. This supercharges atmospheric rivers – huge torrents of water carried above our heads.
The result? You might think you’re safe if you drew on local knowledge and flood maps when choosing where to live. The reality is there always have been gaps in our knowledge, and homes built on floodplains once thought safe may not be any more.
This doesn’t mean we should ignore credible sources of information. But it does mean we have to remember every information source has some uncertainty.
What are the limits of our knowledge?
Local knowledge held by long-term residents, historical records and hearsay are tremendously useful sources.
But these only reach back a short way in terms of the history of flooding. Indigenous knowledge of flooding reaches back far further, with oral stories of the flooding of Port Phillip Bay and many other locations passed down over many generations.
Australia’s floodplains have periodically flooded for millennia, renewing ecosystems.
What’s new are the towns and cities built along their banks. Early European settlers were often taken by surprise by the size of the floods, and a number of rescues were undertaken by Indigenous peoples.
In our time, communities are increasingly turning to flood maps produced by local and state governments to take stock of their vulnerability. This is broadly a good thing, as these maps can drill down to which streets are more vulnerable.

But they aren’t perfect – and they’re mostly only updated every few years. Some councils are still relying on outdated maps.
Flood maps are generated from computer flood models and simulate how floods develop and spread. To do this, you need to consider a range of variables. How much rain falls? When? Where? For how long? Is the ground sodden already, or dry as a bone? What has changed in the catchment since the last flood modelling study that may alter the overland flows of water?
Rain doesn’t fall evenly across catchment areas. Intense rain can carpet some areas and leave others all but untouched. In the devastating 2011 floods in South East Queensland, huge volumes of rain fell in the upper catchment of the Brisbane River, across foothills of the Great Dividing Range. Flash floods hit communities like Toowoomba and Grantham hard, while bayside Brisbane was experiencing light rain and sunshine – and had more time to prepare.
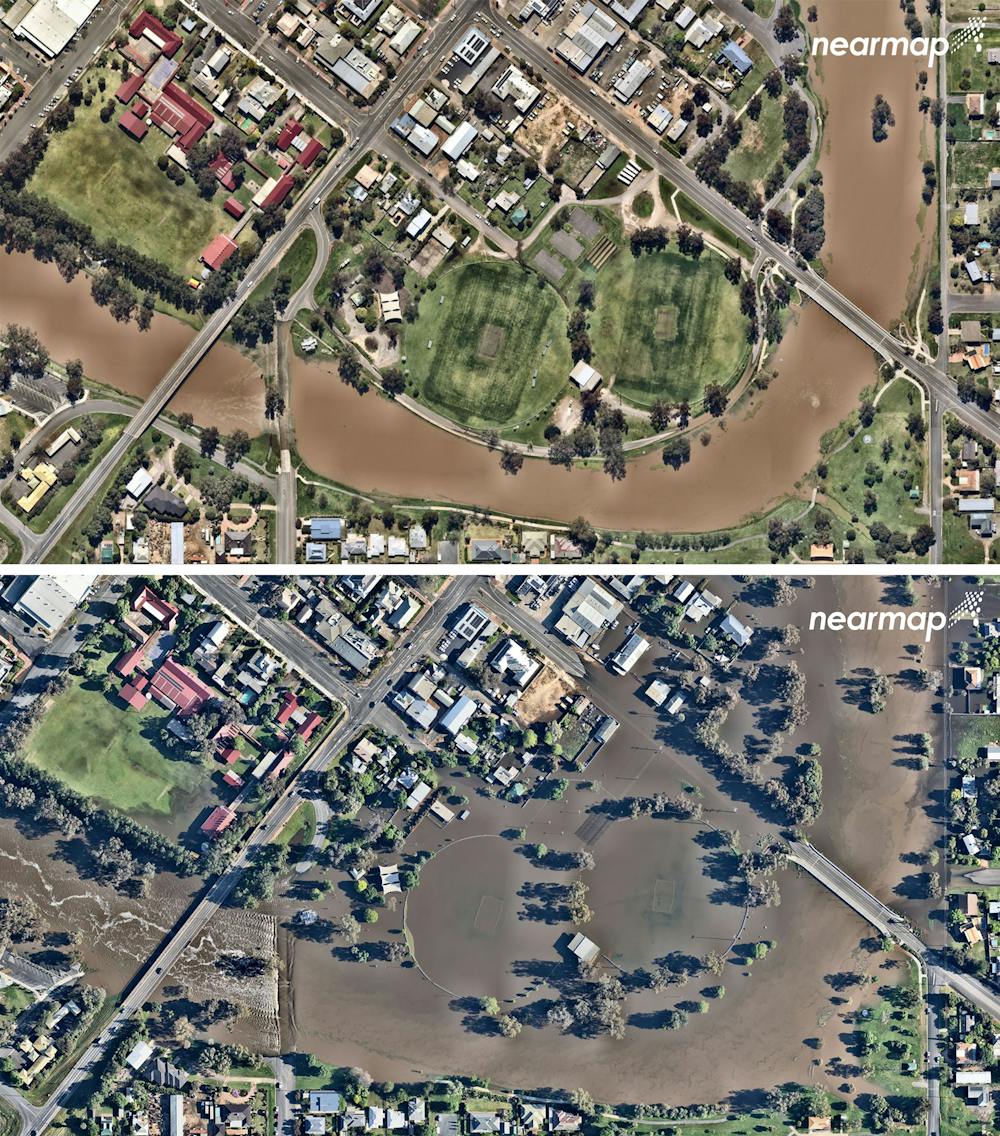
Many of this year’s floods, by contrast, have come from heavy rain falling on lower catchment areas, with repeated soaking priming the area for near-instant floods. That’s partly why cities like Forbes have been taken by surprise, with the worst floods in decades.
In short, every intense or extreme rainfall event is different – and that, in turn, means the resulting floods can differ dramatically.
What information should we rely on?
You can see the challenge for flood modellers. Which events do you model? You can’t model all of them, as it’s impractical to model all possible combinations of rainfall, location and so on. So you model the most likely combinations.
This is a major reason why major floods may not actually flood all of the houses in a designated flood zone in every flood, as it depends in part on where the rain is falling in the catchment.
In turn, this leads to confusion. People in affected communities may believe the flood models and warnings are wrong.
It’s been long understood this kind of information can be complicated and confusing for the people relying on it. Does the Annual Exceedance Probability mean the chance of a 1 in 100 year flood, or not? And if so, how can it flood twice in quick succession? There’s jargon galore.
When vital information is hard to understand, many people may give up and ignore the information. Others may make decisions based on their own interpretation or with social media.
It is hard to sift through complex information. We will need to continue to find ways to make clearer the likely risk for prospective home-owners as well as the danger from the more severe floods we can expect as the world warms.
For now, we need to stay as vigilant as possible on flood risk when choosing where to live. And we need to heed official warnings issued months ahead as seasonal outlooks as well as in the lead up to major rains. It hasn’t flooded here before? Unfortunately, it may be more accurate to say it hasn’t flooded here yet.