
Official explanations of the deterioration in Australia’s productivity growth have tended to emphasise the especially sharp declines in three sectors – agriculture, mining, and utilities (such as electricity, gas, water and waste services).
The Productivity Commission estimates these three sectors account for almost 80% of the decline in multi-factor productivity growth between the growth cycles of 1998-1999 to 2003-2004, and 2003-2004 to 2007-2008, a conclusion endorsed (at least initially) by the Australian Treasury.
More recently, Treasury at least has retreated somewhat from this view.
But I would argue that the slow-down in Australian productivity growth has been broad-based, rather than being largely the result of peculiar outcomes in a handful of industries.
There’s no denying that both labour and multi-factor productivity have fallen sharply in the mining and utilities sectors over the past decade.
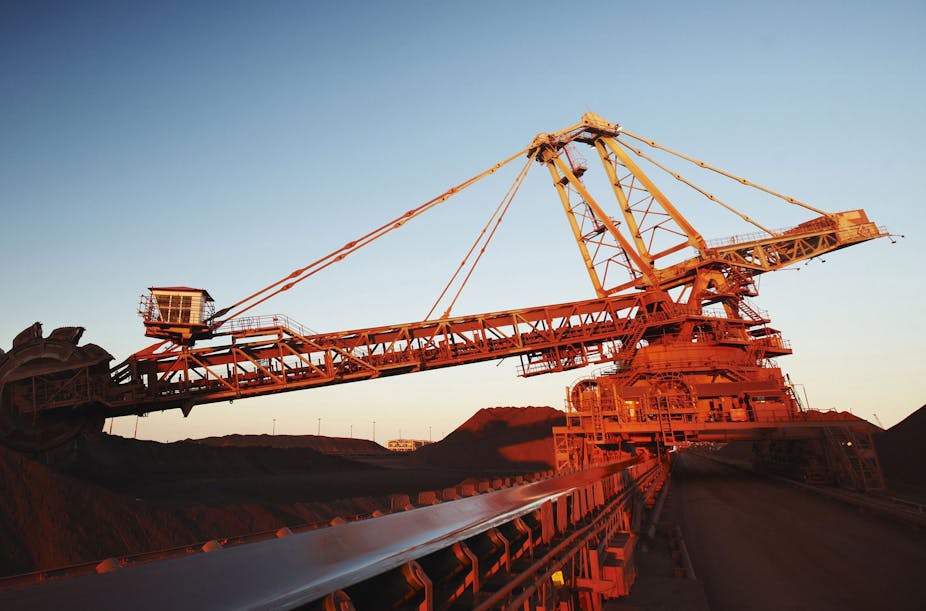
Mining expansion
There are a number of reasons behind this. The mining sector has been gearing up for a huge expansion in response to the demand for energy and minerals (particularly steel-making) from China and India.
To this end, hours worked in mining have more than doubled over the past decade, while the real value of the sector’s productive capital stock has increased by almost 80%.
Yet, largely reflecting the long lead times needed to bring mining projects to full production, the gross value added output of this sector has risen only 37%.
As a result, labour productivity levels have declined at an average annual rate of 6.2% since 2001-02 (or by 41% in total); while the level of multi-factor productivity has fallen at an average annual rate of 4.5% since peaking in 2000-01 (or by 34% in total).
Once these projects reach full production, measured labour and multi-factor productivity should rebound strongly, potentially reversing much of their decline over the past decade.
High commodities prices
Another – possibly less transitory – drag on measured mining industry productivity arises from historically high metal prices, which has made it profitable to extract and refine low-grade deposits, despite it requiring more labour and capital.
This inevitably detracts from measured productivity, even though it represents a logical and profitable business for mining companies.
This drag will persist for as long as metal prices remain high by historical standards.
A different set of factors have resulted in similar trends in productivity in the utilities sector. This was a sector which recorded substantial productivity gains in the 1990s, largely as a result of reforms engineered by state governments.
Electricity and gas
During the past decade, however, electricity and gas businesses have had to invest heavily in response to continued growth in demand, to replace ageing transmission infrastructure, and to meet government-mandated renewable energy targets.
Likewise, governments invested significantly in water infrastructure (including desalination plants in five states), while simultaneously restricting water usage throughout much of the decade, detracting from the output of water businesses without reducing inputs.
In this sector, hours worked have increased by 73% over the past decade, and the real value of the productive capital stock by 35%, whereas output has risen by only 15%: correspondingly, labour productivity has fallen by 34% (an average annual rate of decline of 4.0%) and multi-factor productivity by 31% (or 3.6% per annum).
Agriculture
While agriculture sector output has been affected by drought during the past decade, this hasn’t obviously detracted from Australia’s overall productivity performance over the past decade.
On the contrary, partly as a result of substantial labour-shedding in the early years of the decade, agricultural sector productivity rose at an average annual rate of 3.9% over the 2000s, the second-fastest of any of the 16 industries making up the market sector.
Multi-factor productivity in agriculture rose at an average annual rate of 1.9%, a more rapid rate than any other sector.
The mining and utilities sectors together have over the past decade employed about 19% of Australia’s non-housing capital stock and a little over 2% of Australia’s workforce, to produce about 11% of Australia’s overall output.
On that basis alone it seems prima facie implausible that these two sectors could have accounted for nearly all of the decline in Australia’s productivity since the turn of the century.
Labour productivity
However, to verify this more accurately, we constructed “dollar-denominated” estimates of labour productivity by industry sector (a more detailed explanation can be read on page nine of the report).
The ordering of sectors by output per hour worked accorded in most cases with what one would expect intuitively – sectors such as mining, financial services, rental and hiring, IT and telecommunications, and utilities which used intensive capital and/or skilled labour have higher-than-average output per hour worked.
Sectors with relatively intensive use of unskilled labour, such as retailing, or accommodation and food services, have well-below average output per hour worked.
Our work suggests that the decline in labour productivity in the mining and utilities sectors accounts for less than 10% of the decline in overall market sector productivity growth over the past decade – a considerably smaller contribution than suggested by the Productivity Commission’s earlier analysis.
Broad-based slowdown
The conclusion that Australia’s productivity has slowed across the board is supported by the observation that both labour and multi-factor productivity growth have slowed in all but three of the 16 sectors for which the ABS produces index-based estimates between the 1990s and 2000s.
Those three sectors – construction; administration and support services; and arts and recreation services – account for 9.6% of GDP and 11.2% of gross value added in industry.
This deterioration also appears to have been more broad-based than in other comparable countries.
Comparisons of productivity performance among countries at the industry level are complicated by measurement issues and differences in industrial classification systems.
But according to the 2009 Groningen Growth and Development Centre’s EU-KLEMS database (using data collected to 2007), Australia’s labour productivity growth slowed between 1990-2000 and 2000-07 in 11 of the 15 broad industry groups, compared with seven in the US, nine in the Euro zone, 10 in the UK, eight in Japan (for which the data is available only up to 2006), and eight in Korea.
Most other economies also experienced large declines in labour productivity growth in their mining and utilities sectors (almost as large in the UK as in Australia).
But by comparison with the other economies, Australia experienced particularly large declines in productivity growth in the wholesale and retail trade, transport and storage, financial services, public administration and defence, and education sectors.
Retail lag
The Productivity Commission (2011) has recently fleshed out this relatively poor performance in the context of the retail sector, producing estimates suggesting that labour productivity in that sector in 2007 was some 38% lower than in the United States, some 20-35% below that in Germany, the United Kingdom and France, and only marginally higher than in Spain or Greece.
Both labour and multi-factor productivity growth in retailing had been significantly slower in Australia than in the United States.
The Commission concluded that “it appears likely that the size of the gap between Australia and the US has been increasing; nor has Australia made any significant gains in its position in regards to other leading countries”.
Read Saul Eslake’s full report here.
Tomorrow: Part two: What’s to be done?
You can read our ongoing coverage of productivity issues here.