


The Howard government (1996-2007) shifted migration policy away from family migration and towards skilled migrants. Our recently published research analysed changes in migrant clusters at the level of local neighbourhoods. We also looked at where these clusters are located.
Understanding where cultural diversity occurs and how quickly people are being assimilated can help policymakers to ensure resources are fairly distributed and communities’ resilience enhanced. These issues affect place-based health, urban planning and disaster risk management policies. Better targeting of services is also vital for fostering a sense of belonging, social cohesion and inclusion across Australian society.
In particular, evaluating whether the skilled migration policy has been a success involves understanding whether or not highly educated immigrants are finding jobs that match their qualifications. Our research suggests this hasn’t been the case.
How migrants get a foothold in society
Different theories of settlement and integration make different assumptions about how migrants will settle in society. In our research we found segmented assimilation best characterises migrant experiences from 2001 to 2021. This means there are different “segments”, such as occupations and locations, available to migrants to get a foothold before assimilating.
Using language spoken at home as an indicator, we show diversity is higher in urban areas than in rural areas in all states and territories except the Northern Territory. Diversity is also spread more evenly throughout urban areas. Rural areas have pockets of diversity.
Using language spoken at home, we can see the cultural diversity of protected regions in Northern Territory and Western Australia because of the high populations of Indigenous peoples. A different picture emerges in the cities.
For example, comparing the picture in Sydney in 2001 to 2021, diversity has grown to encompass most of the inner suburbs. It has fallen away in the outer suburbs or peri-urban areas.
Over the same time in Melbourne, diversity has gone from being evenly spread to becoming patchy in the inner areas. (Our research paper maps the diversity changes in the other capital cities.)
While the overall trend of migrant movement is towards the suburbs, we found this trend isn’t statistically significant compared to other trends. For example, other patterns of movement, such as people moving from suburbs towards the city centre, might also be significant.
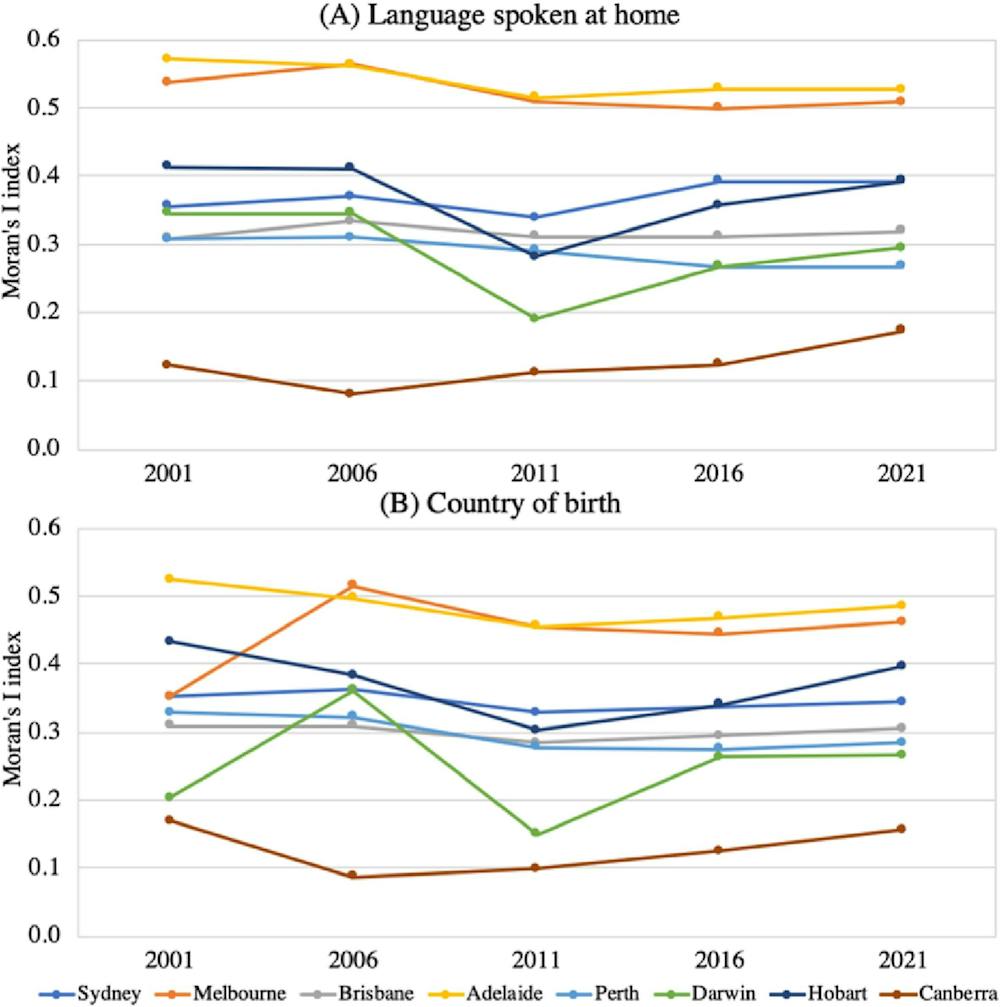
The graphs below show the clustering of diversity in different cities. Zero in the Moran’s index indicates diversity is randomly spread. The index increases as diversity becomes more clustered. For example, there might be schools or other facilities that encourage clustering.
For most of the larger cities clustering is relatively fixed over time. Levels of clustering in Adelaide and Melbourne have stayed higher than in other cities.
What features allow clusters of diversity to persist?
We then examined the features of these clusters across Australia. In other words, what are the physical features of these places? And what are the characteristics of their residents?
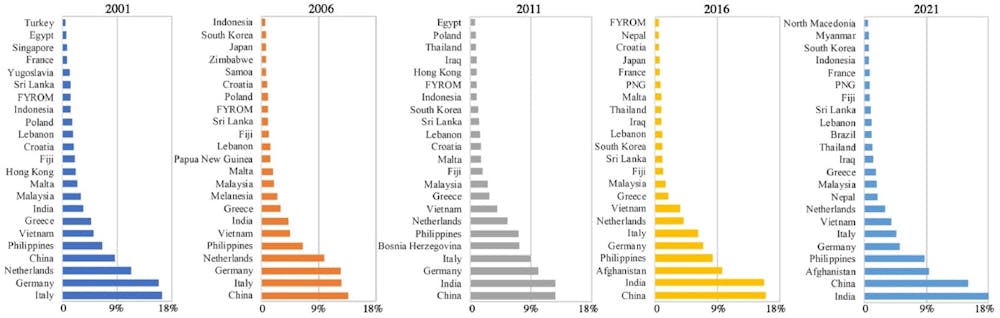
Overwhelmingly, people born in Asia and especially China now dominate clusters of diversity. They have replaced European-dominated migration, which was still apparent in 2001.
Another major shift occurred early in the 2000s and came to dominate during the “skilled migrant” era. This has been the ability of migrants to speak good English. The data show migrants tended to be increasingly tertiary-educated and employed in managerial professions.
Surprisingly, despite these skills, these workers tend to have lower incomes than non-migrants. New immigrants with good education and language skills may have difficulties finding jobs that match their education levels. They earn less than their non-migrant counterparts, which suggests they are overqualified for the jobs they do find.
The data also reveal how much physical features may be associated with diversity. Using an AI technique known as SHAP (Shapley Additive exPlanations) on the five census years (2001 to 2021), we showed travel to work by public transport is most strongly associated with diversity. However, the strength of this falls away over time.
Crowded houses are at first linked with diversity, but this trend is reversed in later years. Rented houses also decrease in association, possibly in line with more migrants owning homes in the suburbs.
Continually diverse, upwardly and outwardly mobile
During the “Hanson years” of immigration policy in Australia, the country moved away from family-based migration towards a policy that made sense economically, but in its extreme form was anti-humanitarian.
Beneath the signature changes in policy on refugees and asylum seekers, our research papers show a longer-term and arguably more significant groundswell of change in our cities. This was assimilation based on migrant desires that all Australians share: good English, home ownership, suburbanisation and good public transport.