
US Democrats have been spooked by some recent polling which suggests that voters intend to pick Donald Trump ahead of Joe Biden in some key states in the 2024 presidential election.
A CNN poll reported on the website Real Clear Politics on November 8 put current US president Biden on 45% and Trump on 49% in such a contest. This lead of 4% is statistically significant, which means that it cannot be attributed to errors which can occur with all polls but represents a genuine lead of the former president over the current incumbent.
This has prompted David Axelrod, an advisor to former president Barack Obama who has been credited with running the latter’s successful campaigns in 2008 and 2012, to tweet: “If he (Biden) continues to run, he will be the nominee of the Democratic Party. What he needs to decide is whether that is wise; whether it’s in his best interest or the country’s?” This illustrates the nervousness among some Democrats about the upcoming presidential election, due to take place on Tuesday November 5 2024.
However, another indicator may suggest there is still strong backing for the Democrats. There have been some notable electoral successes for the party in recent elections for governors in Ohio, Virginia and Kentucky in November 2023. Winning all of these states would be important for the Biden campaign. Abortion was a top issue in all three states, with voters in Ohio also backing a change to the state constitution designed to protect abortion rights, a big Democratic issue.
One concern about Biden is his age (81 on November 20), but also his poor job approval ratings from the American public relating to his work as president. His average approval ratings reported by Real Clear Politics calculated from several different polls is currently 41%. By contrast, an average of 56% of respondents in these polls disapproved of his performance.
That said, we should be cautious about the accuracy of polls in this case. There are questions about the value of presidential approval ratings as a guide to the subsequent performance a year in advance of the election. The chart, below, shows the relationship between presidential approval ratings in November of the year prior to elections, and the Republican share of delegates in the electoral college in these elections. It covers the 19 presidential elections since 1948.
The focus is on delegates in the US electoral college, rather than the percentage vote shares in the contest, since the former decide the outcome of presidential elections, not the latter. The electoral college was put in place by the “founding fathers” of the US constitution to act as a buffer between voters and the presidency. They were concerned that a demagogue might capture the presidency if the voters got carried away by a particular candidate. The electoral college was thought to be a protection from this happening, and the number of votes each state receives is based on population size. So states with a smaller population receive fewer votes.
Hilary Clinton won the popular vote in the 2016 election but lost the contest in the electoral college. Given this, it is questionable as to how successful the institution has has been in practice. But we do need to focus on the college results.
This analysis uses approval ratings for the Republican candidate when that party is in power, and the Democrat when they are in office. This captures the impact of performance of the incumbent on the subsequent presidential election for both parties, although in the chart we are focusing on the Republicans.
The chart shows that there is a rather weak relationship between job approval and electoral college votes a year later for Republican incumbents. The largest discrepancy between the two was in 1972 when Richard Nixon had rather modest job approval ratings in 1971 but went on to win a landslide victory against George McGovern, a weak Democrat opponent. A similar thing happened again in 1984 when Ronald Reagan sought a second term and ran a very successful campaign against his Democrat opponent Walter Mondale.
Republican presidential job approval in year prior to the election and subsequent electoral college shares
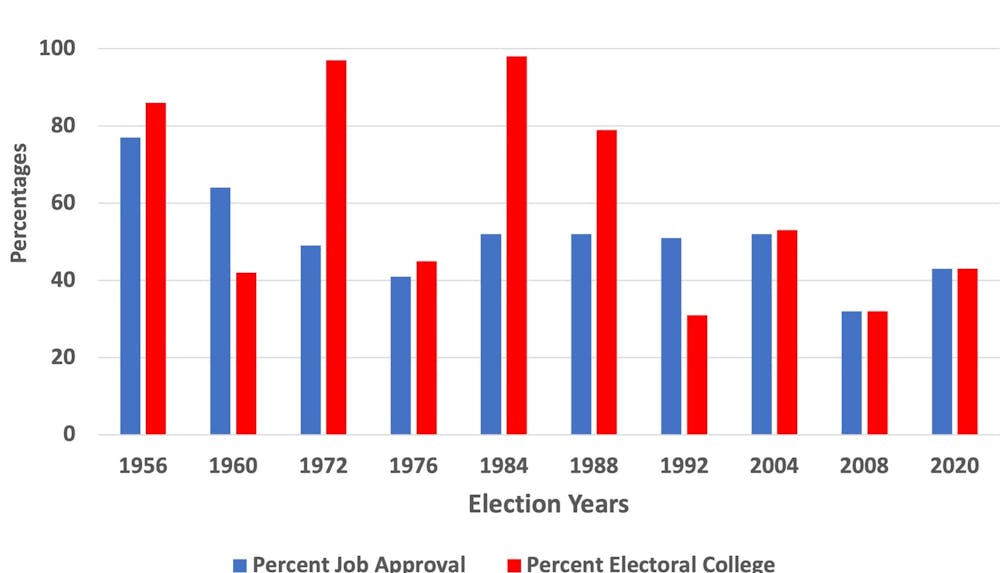
To be fair, this does not always happen since Democrat Barack Obama beat Republican candidate John McCain for the presidency in 2008 after George W. Bush stepped down at the end of his second term as president. On that occasion Bush’s approval ratings in 2007 were poor and the Republican candidate failed to change this in his campaign.
This means if we look at approval ratings for both Democrat and Republican incumbents a year before the presidential election, they are something of a guide to the outcome a year later. But the relationship is weak and if we use it to try to forecast the outcome, then there is a good chance that the forecast will be wrong.
That said, for the sake of argument, let’s assume that this simple model accurately depicts the relationship and so forecasts the effects correctly. If so, what does it predict? The answer is that Biden’s 41% approval rating now predicts that he could get a 53% vote in the upcoming election.
Therefore, Biden would serve a second term. The president’s ratings may be poor, but if this model is accurate, he is still going to win the election. So, it is not a good idea to get too excited about polling results a year ahead of the election.