
In their cost-benefit analysis of the national broadband network, the Vertigan panel predicts that in 2023, an average Australian household will require a broadband download speed of 15 megabits per second (Mbps).
Bill Morrow, the CEO of NBN Co said he is “curious” about this prediction. I would go further and say it is simply wrong, and calls into question the validity of the conclusions of the Vertigan cost-benefit analysis.
Let’s look at the data. The chart below shows average broadband download and upload speeds in Australia from January 2008 to January 2024. The curves in the shaded region in the lower left of the chart are actual measured Australian average upload and download speeds, as reported by Ookla, and reproduced from page 103 of the Vertigan Panel’s report.
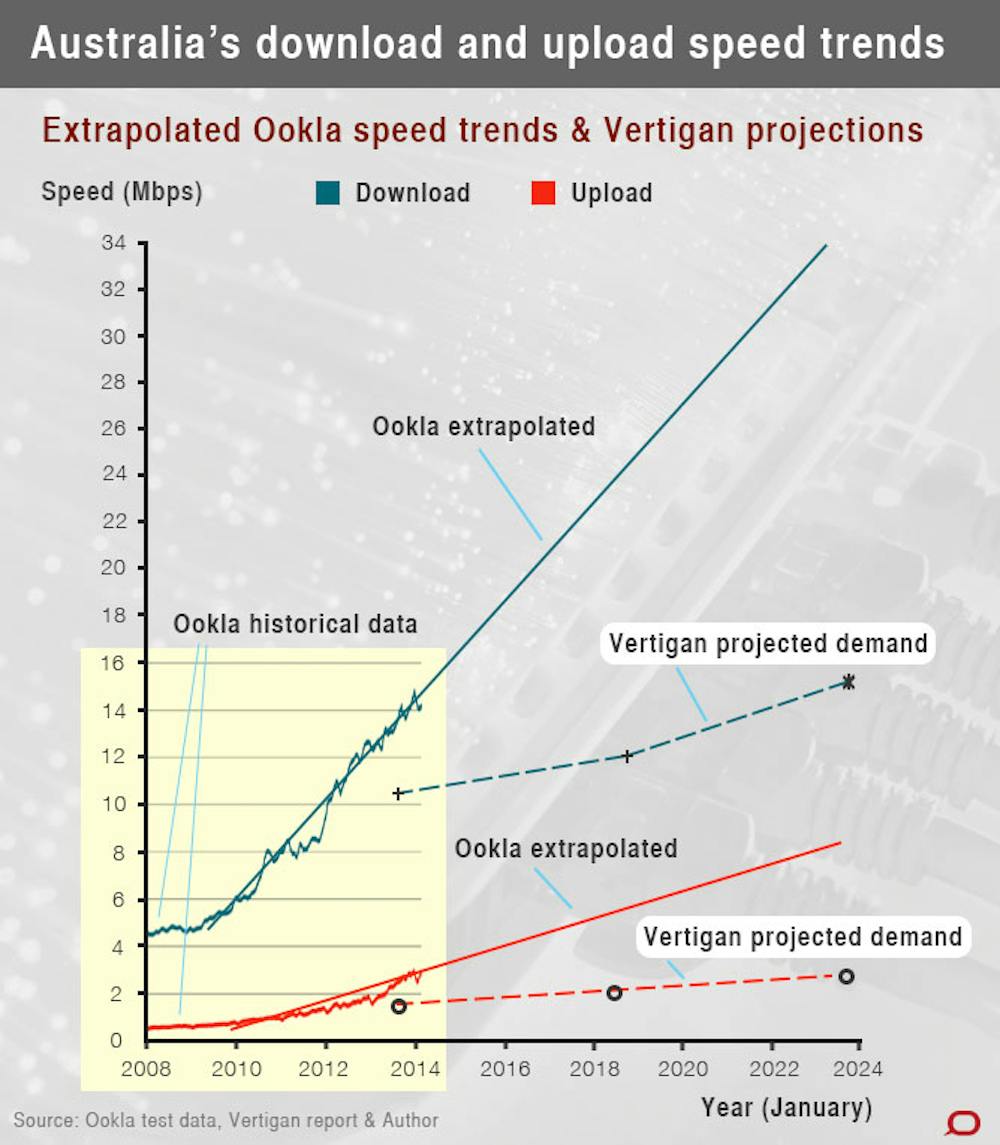
The dotted straight lines in the chart are the projected average download and upload speeds from 2013 to 2023, extracted from graphs on Pages 55 and 57 of the Communications Chambers report as supplied to the Vertigan Panel. Communications Chambers obtained their data by statistically analysing the usage patterns of a variety of known applications in a variety of household types. The data point indicated with an asterisk is the Communications Chambers 15 Mbps prediction for 2023 that found its way into the Vertigan report.
Amazingly, this 15 Mbps prediction for 2023 is less than Ookla’s reported actual average download speed in Australia, today, in September 2014 (16 Mbps).
In other words, Communication Chambers is saying the rapid growth in internet access speed that we have seen in recent years is about to suddenly come to an abrupt end and there is no need for any increase in download speeds in Australia for the next nine years. This defies logic, and it’s a mystery why the Vertigan panel didn’t ask Communications Chambers to check the calculations and fix the data.
And then there’s upload speeds…
Incidentally, the chart also shows data in the Vertigan report for upload speeds is also clearly wrong, with a projected 2.5 Mbps upload speed in 2023, compared with today’s average upload speed of 3 Mbps.
The picture painted by the data in the Vertigan Report is completely at odds with international trends. By comparison with the Australian data, Ookla reports September 2014 average download speeds in the USA of 30 Mbps and in Spain 26 Mbps. In Sweden it is 47 Mbps and in South Korea it is 56 Mbps. The average download speed in Kazakhstan today is 17 Mbps. Kazakhstan currently enjoys higher average download speeds than Communications Chambers thinks Australia will need in 2023.
But it gets worse. The solid straight lines in the chart are projections of actual download and upload speeds that I obtained by extrapolating the real data from Ookla out to 2023. These straight-line extrapolations are conservative because the data rate in broadband networks typically grows exponentially rather than linearly.
Using my conservative linear extrapolations, I estimate that, on current trends, Australians will expect average download and upload speeds in 2023 of around 34 Mbps and 8.5 Mbps, respectively. This is about the same as in the USA today.
What about heavy users?
Communications Chambers and the Vertigan panel rightly recognise there is more to the overall picture than just average upload and download speeds. There are detailed graphs of the percentage of households requiring different download speeds in 2013, 2018, and 2023 on pages 55 and 57 of the Communications Chambers report.
The average speeds plotted in the chart above represent just one point on each of these graphs. Critically, the detailed Communications Chambers graphs show some households will require considerably more than the average download and upload speeds.
For example, the Vertigan report claims that in 2023 the average household will require 15 Mbps, but the 0.01% most internet-active households will require 48 Mbps. In other words, the most active of households require about three times the average of 15 Mbps. This enables Vertigan to come to the conclusion that by 2023, everyone will be well served by the Coalition’s multi-technology mix (MTM) using fibre to the node (FTTN), delivering 50 Mbps. How very convenient.
Serious flaws in the Vertigan report
But what happens if we use my projections of real bandwidth growth rather than the highly questionable Communication Chambers data? If we multiply my projected average download speed of 34 Mbps by the three-times ratio used by Vertigan between high-end users and average users, we find that high-end users will require download speeds of 102 Mbps. If I replace my conservative linear projection by an exponential projection, the required download speed for high-end users will be more than 200 Mbps. A FTTN network cannot provide these speeds; a FTTP network can.
The Vertigan report includes a sensitivity analysis that shows an FTTP network can provide a better net cost-benefit outcome than a FTTN network if the growth in bandwidth demand is higher than used in their analysis. If they had used realistic data for growth in demand, their cost-benefit analysis may well have shown that a FTTP network will provide Australia with the best long-term value for money.
*The chart in this article was updated after publication to change the dotted red “Ookla extrapolated” line into a solid red line.
UPDATE
Robert Kenny from Communications Chambers, the consultancy which prepared the forecasting for the Vertigan panel, has provided the following response:
In the above article Prof Tucker makes serious allegations about our work. However, the sole evidence he offers is a comparison of our numbers to historic bandwidth numbers from Ookla, an internet measurement firm. The Ookla figures are (roughly) for capacity - the capability of the line in question. Our figures are for demand - how much a line is used. The two are completely different things, and to confuse them is a gross error.
For example, Tucker uses the historic Ookla capacity trends to predict future needs. But in doing so he effectively says “because broadband speeds have been improving, we must need evermore speed in future”. If you applied this logic to roads, you’d say “we’ve built some roads, therefore we must build some more roads”, and before you know it, the entire country is covered with empty tarmac.
Tucker also claims that because our median number for 2023 is lower than the Ookla number for today, we are saying that “there is no need for any increase in download speeds”. This is simply nonsense. We made it clear in our report that networks shouldn’t be built for the median user - you’d be disappointing half the people if you did so. If you were building for (say) 95% of users, our forecasts suggest you’d to roll out a network providing 43 Mbps in 2023. Ookla’s average line speed for Australia today is 16 Mbps. How Tucker can look at those two figures and claim we’re saying no increase is required is a mystery.
No-one is saying that broadband demand forecasting is easy or certain. As we said in our report, our forecast is “at best a mid-point projection”, and we genuinely welcome a thoughtful debate.