
The results are in. At yesterday’s federal election, the combined Liberal-National Coalition vote was 45.3% to Labor’s 33.8% in the lower house. This was a primary vote swing to the Coalition of 1.6% and a swing against Labor of 4.1%.
As more votes are counted, Labor’s position will get worse because votes counted after the election tend to favour the Coalition. Labor’s current primary vote is its worst since before the second world war.
This election was also very bad for the Greens, with their vote dropping 3.3% to 8.4%. The Palmer United Party (PUP) debuted at this election with 5.6% of the national vote, including 11.4% in Queensland.
On current figures, the Australian Electoral Commission (AEC) has the Coalition leading in 88 seats to Labor’s 57. However, three of the seats where Labor currently leads will probably have their tiny leads overturned on late counting.
There are also three seats where the AEC erred with its choice of the final two candidates. The votes in Mallee (Liberals vs Nationals), Indi (Liberals vs Independent) and Fairfax (Liberals vs PUP) will therefore need to be recounted over the next week to determine the winners in those seats.
It is likely that Clive Palmer will win Fairfax, but Sophie Mirabella will probably hang on in Indi. I would thus predict a final outcome of: Coalition 92 seats (+19), Labor 54 (-18), Katter’s Australian Party 1, Greens 1, PUP 1 and independent Andrew Wilkie 1.
Labor lost three seats in Tasmania, and now hold only one of five Tasmanian seats. Four seats appear to be lost in Victoria, two in Queensland, one in SA and eight in NSW. The eight NSW losses are mainly because Labor was lucky in NSW in 2010, winning 26 of 48 seats on 48.8% of the NSW two-party preferred vote.
With Labor’s vote slumping from the last election everywhere, a high price was likely to be paid in seat terms in NSW. After the election, Labor is likely to hold 18 of 48 NSW seats, 18 of 37 in Victoria, six of 30 in Queensland, five of 11 in SA, three of 15 in WA and three of four in the ACT and NT.
The AEC’s two party count is currently showing the Coalition leading Labor by 53.3-46.7: a 3.4% swing to the Coalition. However, this excludes two-party preferred counts in seats where one of the final expected two candidates was not from the Coalition or Labor.
At the moment, three conservative and three progressive electorates are excluded, but this number will increase when Indi, Fairfax and Mallee are excluded as well - these are all conservative seats. Eventually, all these seats will be added back, but probably not for five weeks.
The final two-party preferred vote will probably end up at around 54-46 to the Coalition. Labor is lucky that they received a better preference flow from all other parties than at the last election, otherwise the two-party preferred could have been 55-45 to the Coalition.
Final poll comparisons will need to wait for final results, but it is clear that Nielsen and Newspoll both performed well in predicting the Labor and Coalition primary and two-party preferred votes. On the other hand the Lonergan mobile-only robopoll that had the Greens on 14% was simply wrong.
What about the Senate?
Labor’s Senate vote was 30.7%, down 4.7% on 2010, and the Greens also shed 4.4% to have 8.7%. As a result, the total Labor-Green vote was 39.4%, down 9.1%, well short of the 42.9% required for three seats in each state.
The Coalition’s overall Senate vote was also down 1.5% to 37.1%. PUP won 5.1%, and the Liberal Democrats benefited from being confused with the Liberals, winning 3.9% of the overall Senate vote. This included getting 8.9% in NSW, where they were on the far left of the ballot paper, while the Coalition was near the right end.
Primary votes are more important in the Senate than in the House of Representatives because the major parties do not receive much help from minor and micro parties’ above the line tickets. The result of the very poor showing by Labor and the Greens in the Senate was that they lost five combined senators - one in each state except Victoria - thus producing the Senate table of results shown below.
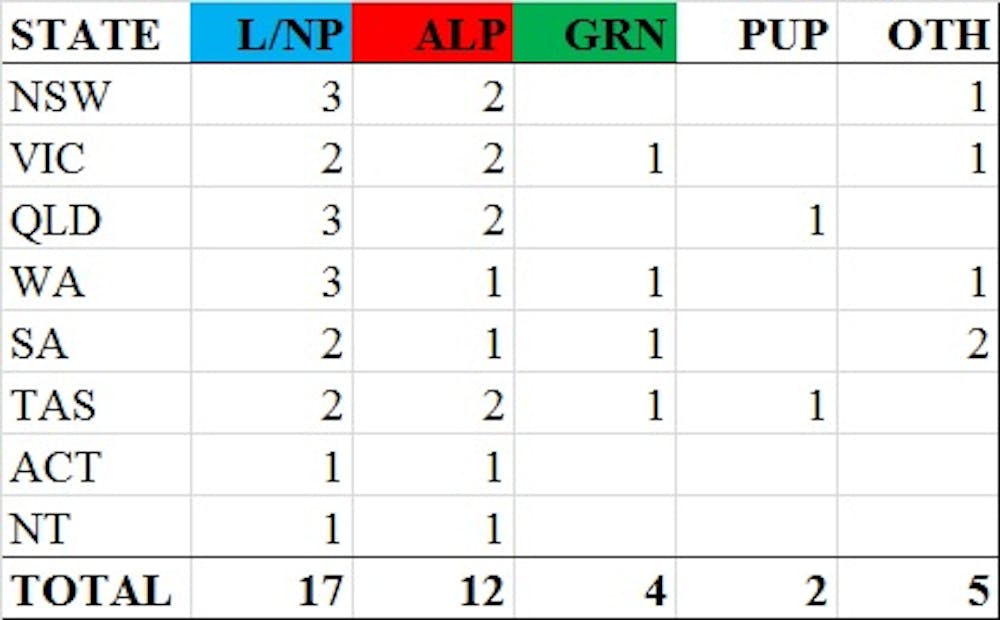
In NSW, “others” are the Liberal Democrats, and in SA they are Nick Xenophon and Family First. In WA and Victoria, the ABC’s Senate calculator currently has two parties that earned less than 0.6% of their state’s Senate vote getting elected. If that result does indeed hold up, it illustrates the need for Senate voting reform.
In the current Senate, Labor and the Greens combined hold a total of 40 seats to the Coalition’s 34, with the DLP’s John Madigan, and independent Nick Xenophon rounding out the 76 Senators.
From July 2014, Labor and the Greens will only have 35 seats to the Coalition’s 33, with most of the rest being small right-wing parties. The Coalition will need to win over six of the eight others to pass its legislation.