

Britain is booming! At least, that’s what George Osborne would have us believe. Casual observers could be forgiven for thinking that the UK economy has indeed entered into a robust recovery from the deep collapse of 2008-2009 and the tediously long stagnation that followed. The UK chancellor says the country’s growth is now the envy of Europe and the US. He immodestly attributes this to his austerity policies.
But, to paraphrase Winston Churchill, this 0.8% quarterly growth is not the end, not even the beginning of the end, nor even the end of the beginning.
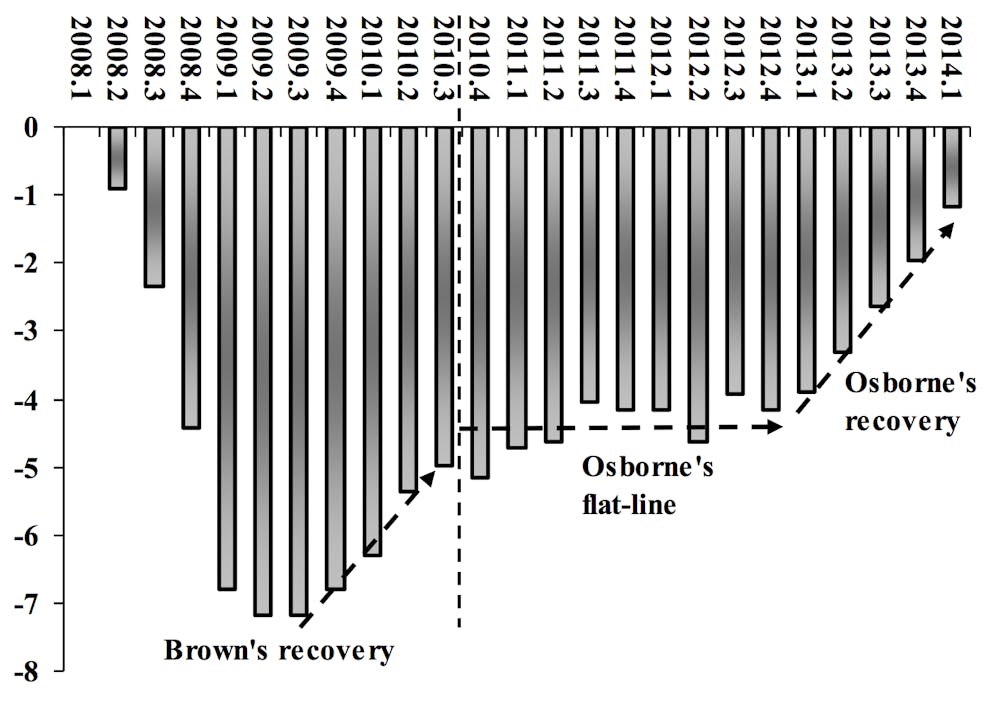
To be specific, the media missed the recovery by four years. It began in mid-2009 and continued unabated until coalition policies killed it off in the second half of 2010.
Are we rich again yet?
The 3% year-on-year growth for the first quarter of 2014 may impress some. It shouldn’t. Even if sustained throughout the whole year it would represent a slow and delayed recovery by any measure, especially compared to previous UK recessions.
Check out the following graph, reproduced from the ONS’ publication Economic Review from July 2013. My only change from the original is to set the pre-recession peak value of GDP at zero rather than 100. As a result every subsequent point on the diagram shows whether GDP is above or below the pre-recession peak.
Recoveries, past and present
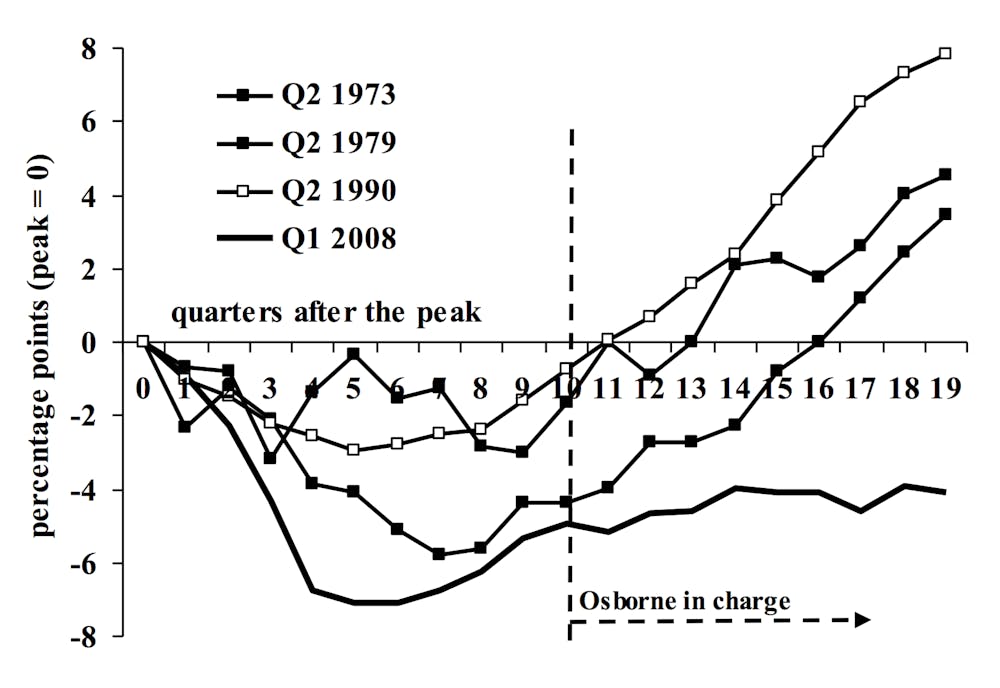
After the 1990 recession, for instance, it took around three years (twelve quarters) for the economy to reach the same level of output. The 1973 recession regained its pre-recession peak after 14 quarters, and the 1979 recession after 17 quarters.
What about the current recession? In mid-2013, after 19 quarters (three months shy of 5 years), we remained 4% below the 2008 peak. Now, 22 quarters have passed and still the economy remains below its peak. Compared to recoveries from other UK recessions, the economy has stagnated under the chancellor’s policies.
Osborne and his defenders allege that the UK recovery may look weak, but it is strong compared to what is happening in other countries, especially those in Europe. But this argument is refuted by data published in the the same ONS Economic Review.
Four recoveries and a fail
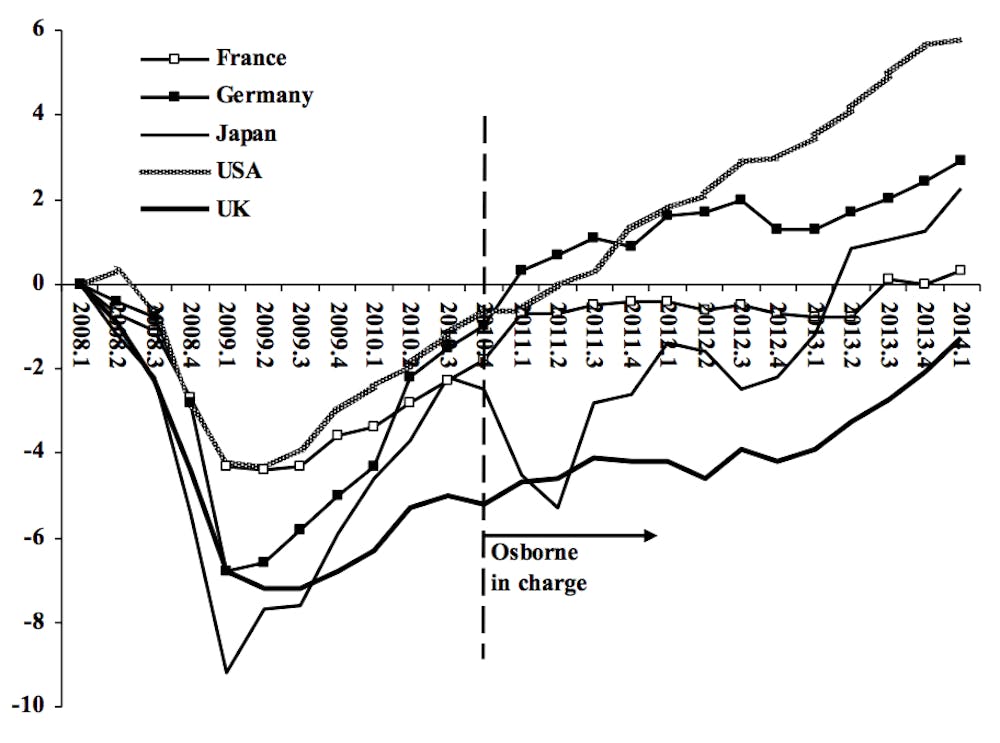
This chart makes embarrassing reading for the government. One country suffered a recession deeper than the UK (Japan), and another almost as deep (Germany). Japanese GDP is now more than 2% above the beginning of 2008, and Germany’s is 3% above. America’s economy has recovered to 4% above 2008.
For France the story could be titled, “creeping along the ceiling”. Following a relatively shallow recession, France’s GDP stagnated for two years at just below the 2008 peak, until the second half of last year. That rather pathetic performance looks good compared to the UK, still below where it was at the beginning of 2008.
Osborne calls this anaemic performance a “strong recovery”, and the media repeats his misrepresentation of reality. Yet you need be neither an opponent of the government nor an economist to recognise that calling recent economic performance impressive is nonsense. You need only read what government agencies report about the economy.
Slow and delayed as it may be, can Osborne claim that his policies at long last stimulated the economy out of stagnation?
The answer is no. To demonstrate government policy has caused economic growth – rather than that one simply came after the other – requires specifying the mechanism by which policy leads to growth, and specifying it before growth occurs. The chancellor specified his mechanism – the favourable impact of deficit reduction policies on interest rates and private sector “confidence”.
But defences of this recovery mechanism encounter the rather basic empirical fact that public borrowing is no lower now than it was one and two years ago. To quote the ONS:
For the financial year 2013/14, public sector net borrowing excluding temporary effects of financial interventions was £95.5 billion. This was £14.8 billion higher than the same period in 2012/13, when it was £80.7 billion.
Simply stated, the chancellor cannot claim that a reduction in borrowing stimulated growth because borrowing was not reduced when recovery occurred. The failure to reduce borrowing is shown in the final chart, taken directly from the ONS.
Measuring borrowing on a monthly or even quarterly basis is quite misleading because borrowing is derivative from expenditure which has large variation over the course of a year. To deal with this problem, the ONS, unlike the chancellor, uses a “rolling” annualised measure, reporting for every month or quarter the sum of borrowing for the previous 12 months or four quarters. This graph excludes “temporary effects” such as Royal Mail pension transfers or Bank of England asset sales:
Still borrowing
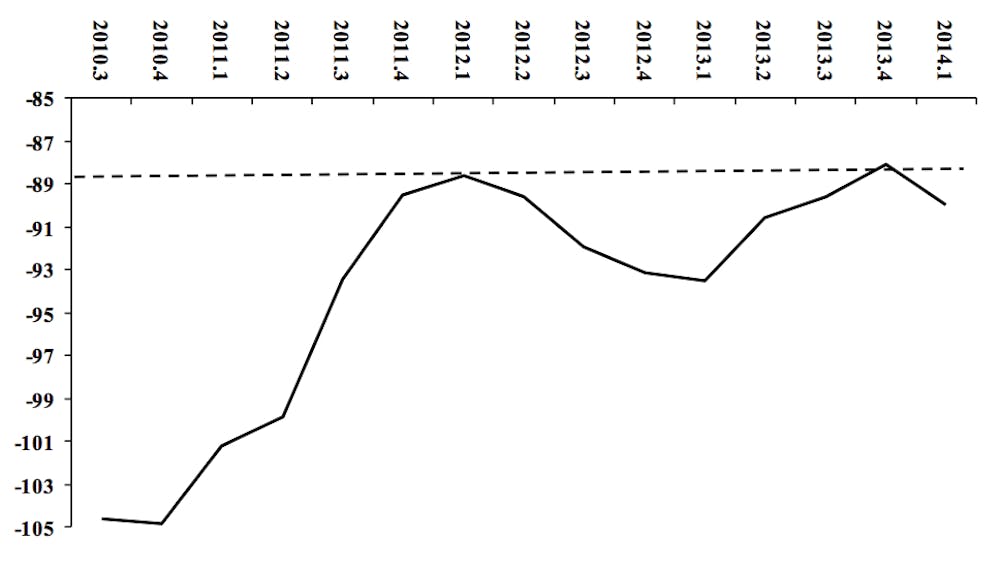
Public borrowing declined substantially in late 2010 and through 2011. But during this time quarterly growth averaged just 0.2% – including two quarters where the economy shrunk – which even the chancellor would not call a “recovery”. There has been no sustained reduction in borrowing over the past two years.
The chancellor claims his policies to reduce borrowing generated a robust recovery. But the “recovery” is not robust, and he has not even reduced borrowing over the last two years.
Osborne’s achievements are quite different. Draconian expenditure cuts achieved an initial reduction in borrowing, which killed a nascent recovery and mired the economy in stagnation for three years.
But such stagnation is uncharacteristic of market economies. They tend to move cyclically, what we once called the “trade cycle”. What the long delayed growth demonstrates is that even under the most incompetent economic management, market economies at some point begin to recover. Congratulations, Mr. Osborne.