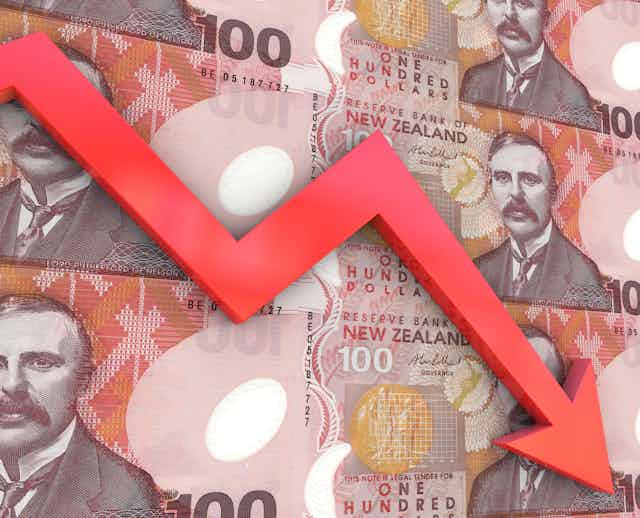

There is an ongoing global debate over whether the high inflation seen in the aftermath of the COVID-19 pandemic can be lowered without a recession.
New Zealand is not immune to this issue. Reserve Bank governor Adrian Orr has said a recession is needed to tame inflation – described as a “hard landing”. Others have disagreed, arguing New Zealand could and should aim for a soft landing (a reduction of inflation with no recession).
But are reductions in inflation inextricably linked to recessions?
New Zealand’s own economic history, it turns out, can give some guidance on this, and point to the risk factors within the country’s economic outlook.
Are we in recession yet?
There is no hard and fast definition of a recession. The term “technical recession” is widely used to refer to a period with two consecutive quarters of negative real growth in gross domestic product. By this measure, New Zealand entered a recession at the end of last year.
But many economists prefer the alternative definition from the National Bureau of Economic Research (NBER) in the United States: a recession is “the period between a peak of economic activity and its subsequent trough, or lowest point”.
Technical recessions and recessions meeting the NBER criteria do not always coincide.
In 2014, two researchers used the Bry-Boschan algorithm, which is based on the NBER definition, to identify New Zealand’s recessions between 1947 and 2012.
The question is whether we can identify these recessions in real time rather than in hindsight. The so-called Sahm rule stipulates a recession is likely when the unemployment rate starts to increase after recent lows, which can help with timely analysis of the economic conditions.
The dashed line in the graph below shows a recession indicator based on unemployment, dating back to 1986 when quarterly unemployment data was first published. The indicator usually coincides (within one quarter) with the start of a recession based on the Bry-Boschan algorithm.
According to this indicator, we were not in recession in the fourth quarter of 2023. However, if the rise in online job applications and fall in job ads continues, this indicator might flash red soon.
The highs and lows of NZ inflation
Since 1961, New Zealand has experienced eight falls in inflation (disinflations) of four percentage points or more. (Disinflation refers to when inflation drops but remains positive, while “deflation” occurs when the inflation rate falls below zero).
This four percentage point drop is required for New Zealand’s inflation to reach the Reserve Bank’s target of 1-3%, down from the 7.3% recorded in the third quarter of 2022.
Each letter in the graph above identifies the inflation peak before historical disinflation episodes. The shaded area identifies recessions up to 2012.
Read more: Degrowth isn't the same as a recession – it's an alternative to growing the economy forever
The graph shows four drops in inflation – B, E, F and C – seem to be associated with recessions, while drops A, D and G were not. Disinflation G does have a recession quite late in the piece, the Asian Financial Crisis, but approximately half the inflation fall had already occurred before the crisis took hold.
The message is a positive one: a fall in inflation does not necessarily have to be associated with a recession.
But are any of the historical disinflation episodes more instructive than others about what might happen in the current situation?
Disinflations D and G, which were associated with soft landings, followed increases in short-term interest rates (such as New Zealand has recently experienced). Disinflation D was also helped by a halving in oil prices between November 1985 and March 1986.
Disinflation H is a bit of an anomaly. The inflation peak in 2011 was an artificial high as it came on the back of an increase in the goods and services tax in 2010.
A common theme with hard landings
Turning to the hard landings in the sample, early 1974 saw a large increase in oil prices after the 1973 Arab-Israeli war. The resulting global recession, coupled with restrictive domestic fiscal policy to quell oil price-induced inflation, contributed to disinflation between the second quarter of 1976 and the fourth quarter of 1978 (marked B on the graph).
Disinflation F, between the second quarter of 1990 and the first quarter of 1992, again occurred against the backdrop of a slowdown in the world economy. This reflected, in part, the increase in oil prices in 1990 due the first Gulf War, and tight domestic monetary and fiscal policies.
Read more: Interest rates: if central banks don't start cutting them soon, it could actually increase inflation
Disinflations B and F share similarities with New Zealand’s current situation, including restrictive (monetary) policy and unrest in the Middle East. Oil prices are up more than 15% this year, although they are yet to reach their mid-2022 highs.
Disinflations C and E were also associated with recessions reflecting global events. During deflation C, events in Iran led to an oil price increase, which both directly and through policy actions sent the US into recession in the early 1980s.
Disinflation E coincided with the October 1987 sharemarket crash which set off instability in New Zealand’s newly-liberalised financial system.
So if New Zealand is not currently in a recession, what are the country’s chances of avoiding one while trying to reduce inflation?
History suggests it is possible. But favourable global conditions are needed and, in particular, favourable geopolitics. Recent events in the Middle East, coupled with the ongoing war in Ukraine, are not positive signs.