


If you think the party that has presided over the most sustained fall in our living standards since records began… then the Liberal Party is the party for you. – Shadow Treasurer Chris Bowen, Treasurers’ Debate, May 27, 2016.
During the Treasurers’ debate with federal treasurer Scott Morrison at the National Press Club, Shadow Treasurer Chris Bowen said that the Liberal Party had presided over the most sustained fall in Australian living standards since records began.
Bowen has made similar claims in the past.
Is he right?
It depends a bit on which dataset you’re looking at.
Checking the source
When asked for a source to support his assertion, a spokesman for Bowen supplied a spreadsheet downloaded from the Australian Bureau of Statistics’ Australian National Accounts: National Income, Expenditure and Product data set. He highlighted this column:
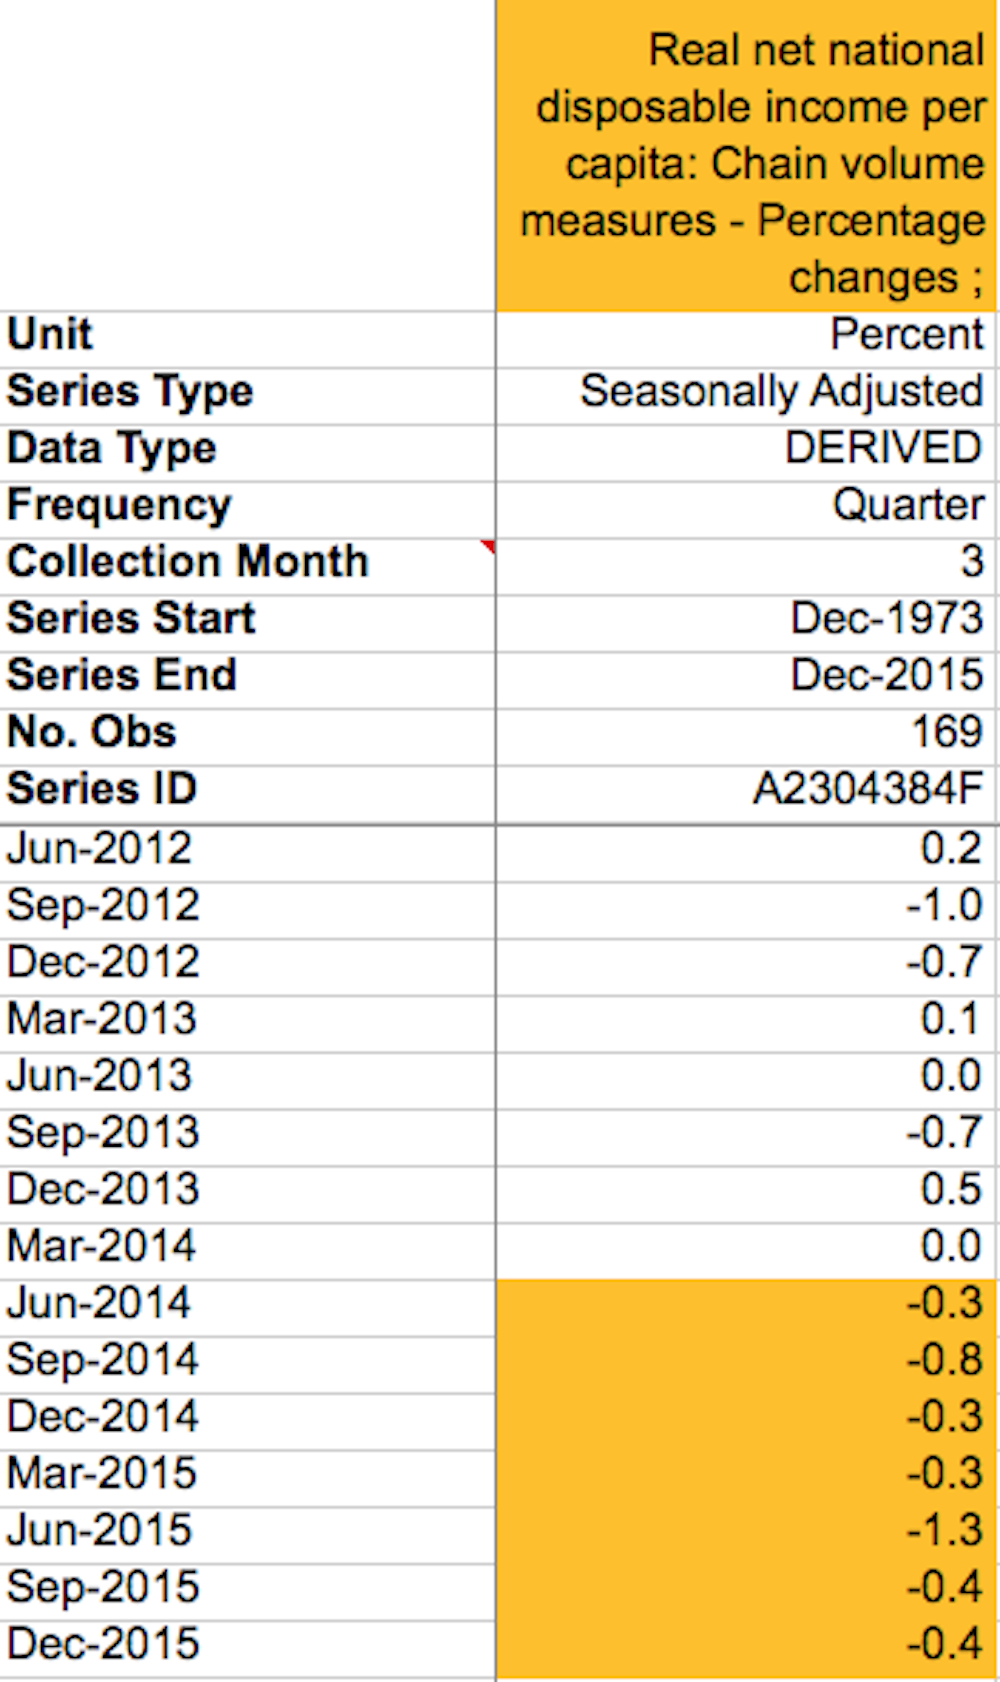
The spokesman said:
Living standards (as measured by “real net national disposable income per capita” or more generally referred to as “income per person”) have now fallen for seven consecutive quarters – the first time this has happened since records began.
Is the claim accurate?
It is true that real net national disposable income per capita fell for seven quarters between June 2014 and December 2015 inclusive, using the seasonally adjusted series. That was the latest data available when Bowen made the comment.
In fact, the latest data (released after Bowen made the claim) shows that real net national disposable income per capita has now fallen for eight consecutive quarters – between June 2014 and March 2016. The chart below shows how it changed between Dec 2007 and March 2016:
The ABS started publishing data on household income per capita in the December quarter of 1973. There were two quarters of negative growth starting in December 1981 and four quarters of negative real growth from September 1982 to June 1983, inclusive. These falls were interrupted by one quarter of growth in the June 1982 quarter.
The same pattern recurred between June 1989 and June 1991 – two quarters of real falls, one quarter of growth, and then another four quarters of falling living standards.
There were also real falls in living standards for four quarters at the time of the global financial crisis in 2008-09.
Overall, using this particular measure of household living standards, the shadow treasurer was correct. The period since the June quarter of 2014 has seen the longest uninterrupted period of falls in real household disposable income per capita, on a seasonally adjusted basis.
Other long periods of sustained falls in living standards
Chris Bowen’s statement is right if you use the seasonally adjusted numbers – meaning the data that is smoothed out to minimise the effect of seasonal factors such as Christmas.
The ABS also publishes trend data on real net national disposable income per capita. This statistical technique smooths out the data even further to remove the effect of outliers; it’s more signal than noise.
In the explanatory notes to the National Accounts, the ABS says that
Given the qualifications regarding the accuracy and reliability of the quarterly national accounts, the ABS considers that trend estimates provide the best guide to the underlying movements, and are more suitable than either the seasonally adjusted or original data for most business decisions and policy advice. [emphasis added]
Looking at the trend series – rather than the seasonally adjusted figures used in the response by Bowen’s spokesman – gives a slightly different picture of different periods.
On these numbers, in addition to the seven quarters of real income falls between June 2014 and Dec 2015 (the latest data available when Bowen made the claim), there were seven quarters of falling living standards between December 1981 and June 1983, and again between December 1989 and June 1991, inclusive.
Some of those periods happened when Labor was in power.
Living standards have not risen since December 2011
The trend series also shows that real household living standards have not risen since the December quarter of 2011 – that is 17 quarters ago. This is an unprecedentedly long period in which real living standards have not risen – one that started when Labor was in government, but has not been reversed since the change of government in 2013.
Cumulatively this amounts to a 6.1% reduction in real household disposable income per capita since December 2011. That is slightly greater than the 6.0% real fall in 2008-09 and approaches the 6.4% real fall in the 1990s recession. However, it is still less than the 7.5% real fall in the recession of the early 1980s.
Is this the only way to measure living standards?
There are a range of alternative measures of living standards that could be considered. Gross Domestic Product per capita, for example, has not fallen in real terms since the March quarter of 2009.
However, GDP per capita is widely recognised as an inadequate measure of household well being. Indeed, in the 2013 results for Measuring Australia’s Progress, the ABS said that
Real net national disposable income per capita is considered a good measure of progress for enhancing living standards, because it is an indicator of Australians’ capacity to consume goods and services.
Verdict
Chris Bowen’s statement was accurate – but it also didn’t tell the whole story.
Looking solely at the “real net national disposable income per capita” figures for Australia, which were the source of Bowen’s claim about a sustained fall in living standards, the shadow treasurer was correct. The period since the June quarter of 2014 has seen the longest uninterrupted period of falls in real household disposable income per capita, on a seasonally adjusted basis.
But according to the Australian Bureau of Statistics, the trend estimates on real net national disposable income per capita provide the best guide on shifts in Australian society and its economy.
That trend estimates data reveal that real household living standards in Australia have not risen since the December quarter of 2011, or 17 quarters ago. It’s an unprecedentedly long period in which real living standards have not risen – which began when Labor was in government and which has not been reversed since the Coalition took power in 2013. – Peter Whiteford.
Review
There are many potential ways to measure living standards, but the national accounts provide the longest-running and most consistent measures. Real net national disposable income per capita is the ABS preferred measure of average living standards, and it is the seasonally adjusted series of this measure that the shadow treasurer has relied on.
This series has now declined for eight successive quarters, which is the longest sustained decline since September 1959 (the earliest quarter for which the measure can be calculated). If we instead examine the trend series, the current period of decline extends to 17 successive quarters.
Net national disposable income per capita is not, however, a measure of household disposable income per capita. To measure household incomes using the national accounts, one must draw on the household income account (Table 20 in the quarterly national accounts published by the ABS).
The figure below shows quarterly percentage changes in seasonally adjusted real household disposable income per capita. This provides a measure of how average household incomes have changed, which I would argue is a better measure of changes in the living standards of Australian households.

It shows that average household incomes have declined in only four of the last eight quarters. So, tested against this particular data set, the shadow treasurer’s statement would be incorrect.
What’s driving the difference between net national disposable income and household disposable income? In part, it is rising government debt, which is acting to support living standards of households despite falling net national disposable income. National income is declining but household income is not declining quite so much because the government is going into debt. (In the most recent quarters, an increase in corporate debt also helps to explain the gap.)
A further caveat is that the national accounts tell us nothing about the _distribution _of income. For example, if incomes of the rich have been growing strongly in recent years, the median household is likely to have experienced a decline in real income.
Household income surveys are the preferred source for questions of distribution, but these are less regular (especially prior to 1994). They are also less consistent than the national accounts in methods and measures across years. – Roger Wilkins