


“Today’s drop-out rates are higher than ever before, 20% across-the-board, and in some cases one-in-two. And that’s just one side effect of the demand driven system.” National affairs correspondent Heather Ewart, ABC’s 7.30, 17 July.
The government publishes several figures relating to drop-out rates and the most accurate are adjusted to take account of students transferring between universities. A student who leaves one university to enrol in another hardly “drops out” of university.
Ewart says the figure of 20% was provided to her by the media office of higher education minister Kim Carr, but based on available data, it doesn’t appear to be correct.
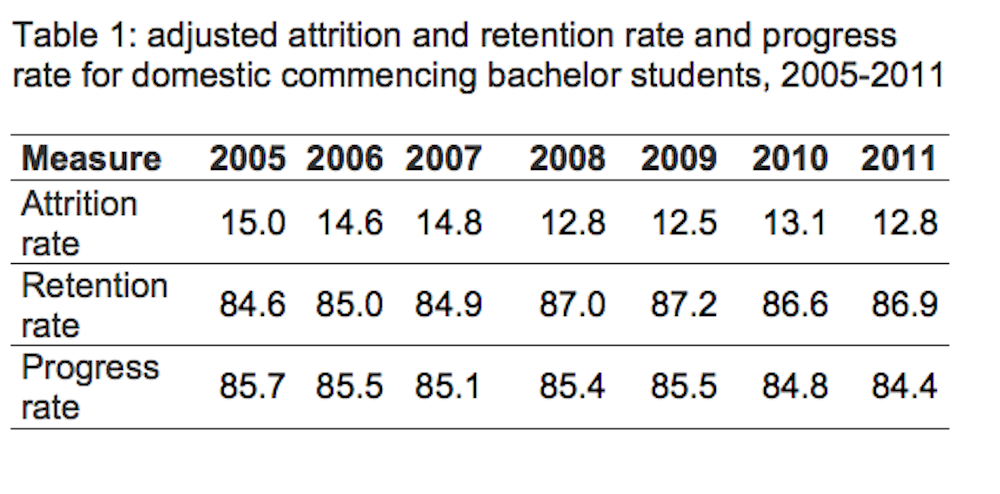
The table below shows attrition or drop-out rates adjusted for students transferring between institutions. It also shows adjusted retention rates, which are calculated somewhat differently – they are not just the inverse of attrition rates. It is clear that attrition rates are well below 20% and that they have improved since 2005, the earliest year for which the department published these figures. Retention rates are well above 80% and have also improved since 2005. The highest attrition rate the department reported was 19.8% for 2002, not adjusted to take account of inter-institutional transfers.
We can also consider the progress or pass rate, which is the number of subjects passed as a proportion of the number of subjects enrolled. The progress rate for domestic students commencing a bachelor program in 2011 was 84.4%, which has fallen somewhat since 2005.
Progress rates are not adjusted for student transfers so the government is able to report them from 2001, when they were 84.8%. So even progress rates have always been well above 80%. If anything, the fall in the progress rate since 2009 indicates that universities have not lowered their standards since enrolment caps were lifted in 2009.
The department also publishes progress rates and adjusted and unadjusted attrition and retention rates for each public higher education institution. These differ markedly between institutions, mostly by their students’ entry scores.
Batchelor Institute of Indigenous Tertiary Education in the Northern Territory had the highest adjusted attrition rate, of 49.2% in 2010. This subsequently improved, presumably as a result of its partnership with Charles Darwin University. Central Queensland University had the second highest adjusted attrition rate of 30.9% in 2005, which improved to 27.3% in 2011.
The next highest adjusted attrition rates are in the mid- to high-20% range at Charles Darwin, New England, Southern Cross, Southern Queensland and Sunshine Coast universities in 2005 and 2004. However, all have subsequently improved.
Verdict
This statement is false.
Review
Based on current government data, I agree that this statement is false. However the statement might be classified “unsubstantiated”, if it is relying on the most current - but as yet unpublished - statistics.
In the 7.30 story, Heather Ewart referred to “today’s drop-out rates” as “one side effect of the demand driven system”. Both phrases suggest that the statistics underpinning this assertion are the attrition rates for 2012, that is, the year the government completed its transition from a supply to a demand system of funding, which meant there was no longer a government cap on student places. This cannot be corroborated because, as the author has shown, official statistics are only available for the years 2002-2011.
The tables do include progression rates for 2012 from which, as explained, attrition rates can generally be extrapolated. However, I agree these do not support the claim of a “20% across-the-board” drop-out rate.
Batchelor Institute did have a 50.15% progression rate in 2011, which counts as “one-in-two”. However, it was only one incident. Furthermore, the most recent progression rates refer to students progressing in 2011-2012, not in 2012-2013. So none of this data has a direct bearing on the consequences of moving to a demand-side funding model in 2012.
Therefore, based on current data, the statement is false.
If, however, the statement refers to the most recently completed academic year (2012) then the statement may be true, but it is unsubstantiated. - Tim Pitman