


“The OECD says that we are a high equity nation in terms of our students… I don’t believe there is an equity problem in Australia.” – Education Minister Christopher Pyne, Lateline interview, 26 November 2013.
In the heat of political tensions around school funding, Education Minister Christopher Pyne has been forced to respond to longstanding debates about equity in Australian education.
On ABC’s Lateline last week, Pyne said Australia is a “high equity nation” according to the Organisation for Economic Cooperation and Development (OECD). He also said he does not believe there is “an equity problem” in our country.
So what does the OECD actually say about equity for Australian students? And is there a broader equity problem in education?
What the OECD says
The OECD measures education equity through a diverse range of indicators, but its most prominent is its Programme for International Student Assessment (PISA). This measures a worldwide sample of 15-year-olds in reading, mathematics and science and the latest PISA results were released this week.
The OECD ranks nations in terms of quality (the comparative level of PISA performance) and equity (the correlation between students’ socio-economic background and performance). According to this framework, a perfectly equitable system is one in which socio-economic background factors have no bearing on student performance.
Unsurprisingly, no such system exists. OECD data shows conclusively there is always a correlation between background factors and performance. In relative terms, however, some nations (such as Hong Kong and Finland) can be considered more equitable than others.
The latest PISA data does describe Australia as “high quality, high equity” as our performance was above the OECD average (quality) and student background has a less significant impact on performance than the OECD average (equity).
But this “high quality, high equity” characterisation is very misleading, as Australia is only more equitable in relative terms. In other words, we are only marginally more equitable than others in a context of documented inequality.
More importantly, when the latest PISA data is broken down further, Australia appears far from equitable. For example, OECD data suggest young Australians in the lowest socio-economic quartile perform much worse on PISA than the rest and those in the highest quartile perform significantly better.
In fact, a difference, equivalent to around two-and-a-half years of schooling, separates the maths, reading and science scores of students in the highest socio-economic quartile and students in the lowest socioeconomic quartile.
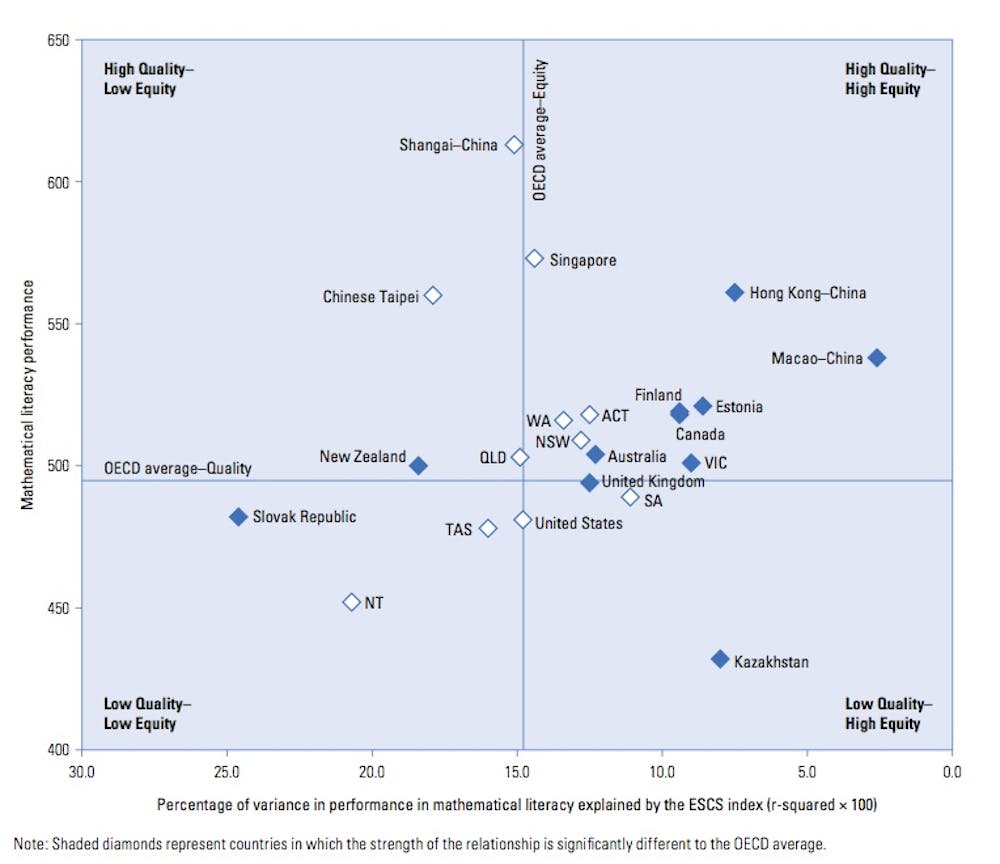
Significant gaps in student achievement are also evident by gender, indigenous and immigrant status. State and territory differences are also marked. As the graph below shows, some Australian states are much less equitable than others when it comes to mathematical literacy, including Tasmania and the Northern Territory, which fit into the “low quality, low equity” quadrant.
In addition to PISA, there are many other equity indicators used by the OECD. School drop-out data, for example, shows nearly a third (29%) of Australians between the age of 25-64 have not attained a senior school certificate — a figure worse than most countries, including Estonia (11%) and Slovak Republic (9%).
The Australian education system is also deeply stratified. OECD data shows, for example:
Young Australians in the top socio-economic quartile are around three times more likely to attend a private school than those in the bottom quartile.
Disadvantaged young people are more than seven times more likely to attend a disadvantaged school than an advantaged one.
Australian schools in high socio-economic areas are much more likely to have better quality educational resources.
Another relevant indicator is national expenditure on education, reported as a percentage of gross domestic product. On this measure, Australia is below the OECD average of 6.3%. In fact, Australia is less generous than many low-income countries, including Mexico.
Is there a broader ‘equity problem’?
The second part of Pyne’s claim suggests there is not an equity problem in our nation. Aside from the preceding OECD data, this claim is inaccurate.
The evidence tells a time-worn story: if a young person goes to a well-resourced private school or a public school in a high socio-economic area, they are much more likely to do better on a wide range of indicators, including academic performance, entry to further education or training, and post-school employment.
There are multiple data sources that attest to this.
In terms of student achievement, for example, NAPLAN results (available on the My School website) show clear patterns of disadvantage in terms of gender, race, socio-economic background and geographical location.
These patterns of disadvantage are further evident in terms of school completion and post-school destination data, documented in post-school surveys such as Next Step in Queensland and On Track in Victoria.
Young people from poorer backgrounds are also much more likely to take vocational pathways that lead to relatively poor post-school outcomes, whereas young people from wealthier backgrounds are much more likely to attend university and achieve better post school outcomes.
Beyond “hard data”, it is important not to ignore the experiential dimensions of educational inequality. Since Connell and colleagues published Making the difference: Schools, families and social division in 1982, decades of research in sociology of education have documented the lived experiences of inequality in Australian education.
The everyday experiences of educators and students in remote schools or many public schools in Sydney’s Western suburbs, for example, contrast dramatically with those in our nation’s elite private schools.
These contrasts reinforce the fact that young people don’t arrive at the school gate with the same chances.
Verdict:
On the first part of Pyne’s claim, he is technically correct when he says the OECD describes us a “high equity” country but this is misleading. Whilst OECD data suggests a lower correlation between student background and performance compared to the OECD average, inequalities based on student background are still pronounced. There is also a diverse and complex range of additional inequalities in the Australian education system.
Review
The article is an accurate assessment of Pyne’s claim. As the comparative OECD information shows, Australia is only just above the average on equity measures. But in Australia - as in so many other countries - life chances continue to be largely determined by parental (especially a father’s) income and occupation.
The problem with Australian education equity is that there are a range of multiplier effects. That is, a boy from a low socio-economic background, who goes to a poorly-resourced school and lives in a low socio-economic status suburb in Tasmania for example, tends to do substantially worse than a girl from a higher socio-economic status background, going to a selective or elite private school and living in a high socio-economic status suburb in the ACT, especially in an area like literacy. All of those factors have a significant influence on their educational outcomes.
In the end, Pyne’s claim there is no equity issue in Australian education is simply not correct. - Peter West.