

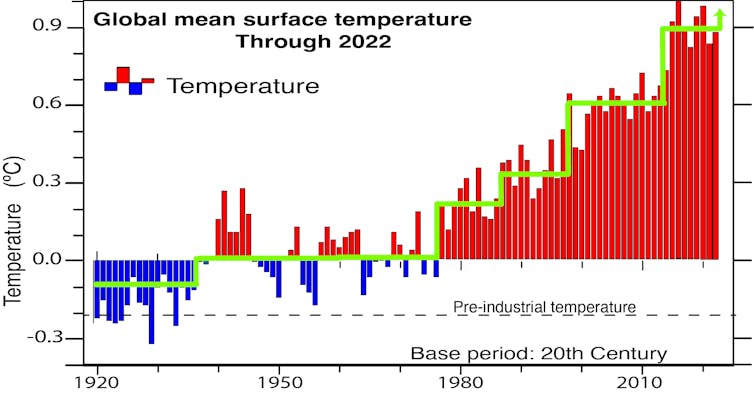
Global warming took off in the mid-1970s when the rise in global mean surface temperature exceeded natural variability. Every decade after the 1960s has been warmer than the one before and the 2010s were the warmest on record. But there can be a lot of variability from one year to the next.
Now, in 2023, all kinds of records are being broken. The highest daily temperatures ever recorded globally occurred in early July, alongside the largest sea surface temperature anomaly ever.

June had its highest global mean surface temperature, according to preliminary analysis. The extent of Antarctica’s sea ice has been at a record low. Meanwhile, atmospheric carbon dioxide concentrations continue to increase at rates that show no sign of slowing.
Evident consequences include torrential downpours in some parts of the world which contrast with excessive heatwaves and wildfires in other locations, notably recently in Canada.
But global mean surface temperature does not continue relentlessly upwards. The biggest increases, and warmest years, tend to happen in the latter stages of an El Niño event.
Human-induced climate change is relentless and largely predictable. But at any time, and especially locally, it can be masked by weather events and natural variability on interannual (El Niño) or decadal time scales.
The combination of decadal variability and the warming trend from rising greenhouse gas emissions makes the temperature record look more like a rising staircase, rather than a steady climb.
Read more: Why are so many climate records breaking all at once?
Sources of variability
Atmospheric carbon dioxide concentrations continue to climb relentlessly upwards despite the Paris Agreement and the many countries and organisations (cities, companies) that have made good on their commitments to cut emissions.
Unfortunately for the planet, some nations, including China and India, have continued to burn coal and install coal-fired power stations whose emissions more than offset gains elsewhere.
But the rise in temperature follows a step-like progression. The warmest year in the 20th century was 1998, following the 1997-98 major El Niño. Then the warming paused and the so-called “hiatus” in global warming from 2001 to 2014 led climate change deniers to become vociferous in proclaiming global warming was a myth.
The major El Niño event in 2015-16 changed that. 2015 became the warmest year on record, ending the hiatus, only to be surpassed by 2016, which remains the warmest calendar year so far in many records.
A lot of year-to-year variability is associated with El Niño events. But it is more than that. Further analysis reveals that the Pacific decadal variability, sometimes referred to as the Pacific Decadal Oscillation or Inter-decadal Pacific Oscillation, resulted in changes in the amount of heat sequestered at various ocean depths.
The Pacific Decadal Oscillation may be thought of as a northern-hemisphere version of the Inter-decadal Pacific Oscillation.
With the Pacific Decadal Oscillation, there were major changes in Pacific trade winds, sea-level pressure, sea level, rainfall and storm locations throughout the Pacific and Pacific-rim countries. These changes extended into the southern oceans and across the Arctic into the Atlantic.
The effects are greatest in winter in each hemisphere. There is good but incomplete evidence that changes in winds alter ocean currents, ocean convection and overturning, resulting in changes in the amount of heat sequestered deep in the ocean during the negative phase of the Pacific Decadal Oscillation.
Accordingly, during the positive phase of the Pacific Decadal Oscillation, more heat is deposited in the upper 300m of the ocean, where it can influence global temperatures. During the negative phase, more heat is dumped below 300m, contributing to the overall warming of the oceans but lost to the surface.
During El Niño, heat stored at depth in the western tropical Pacific is moved around and returns to the atmosphere, providing a mini global warming.
Temperatures rising
Research shows that ocean heat content increases more steadily than surface air warming and is a better metric to show that global warming continues.
Sea-level rise comes from both the expansion of the ocean as it warms and the melting of land-based ice (glaciers and ice sheets in Greenland and Antarctica). This puts more water into the oceans. Fluctuations occur as rainfall is partitioned differently between land and the ocean, with more rain on land during La Niña events.
Read more: Ocean heat is off the charts – here's what that means for humans and ecosystems around the world
The ocean covers 70% of the Earth. Because most of it is in the southern hemisphere, which experiences winter in June to August, the highest values for sea-surface temperatures occur in March, at the end of southern summer. But as land temperature variations are much larger, the highest global mean surface temperatures occur about July.
With a new El Niño emerging and prospects that it could be another major event, are we about to experience the next step up the stairs? Already in 2023, sea-surface temperatures emerged in April as the highest on record and values are running 0.2°C above previous highs.
This set the stage for June to have record high surface air temperatures globally. In early July, they hit the highest values on record.
We can expect 2023 to emerge as the warmest year to date. But sea-surface temperatures during El Niño events tend to peak about December and have the greatest influences in the subsequent two months. That sets the stage for 2024 jumping up the staircase to the next level, perhaps to 1.4°C above pre-industrial levels, with likely daily incursions over 1.5°C.
Once the next La Niña event comes along, there’ll again be a pause in the rise, but values will never quite go back to previous levels.