National statistics, such as GDP, exports and imports, are commonly referred to as the economy’s “vital signs”. They give the public a snapshot of the economy’s health, the same way a doctor may check your blood pressure, temperature and heart rate to provide a quick health assessment.
These economic figures are now at the centre of the public’s understanding of how the country is faring, particularly after Brexit. The latest snapshot has been published by the Office of National Statistics in the form of data on UK exports for 2019. The headline read: “2019 was record-breaking year for UK exports”, with “UK exports at an all-time high, with goods exports to non-EU countries growing by 13.6% on 2018”.
The secretary of state for international trade, Lizz Truss, said:
The UK is an exporting superpower and these new statistics show that UK economies are exporting record levels of goods and services … As a newly independent trading nation, we will strike new deals with key partners across the world, open up new markets and make it even easier for our businesses to meet global demand.
But this is an illusion and not a true representation of the data – data which has been skewed by a very strange and exceptional movement of gold.

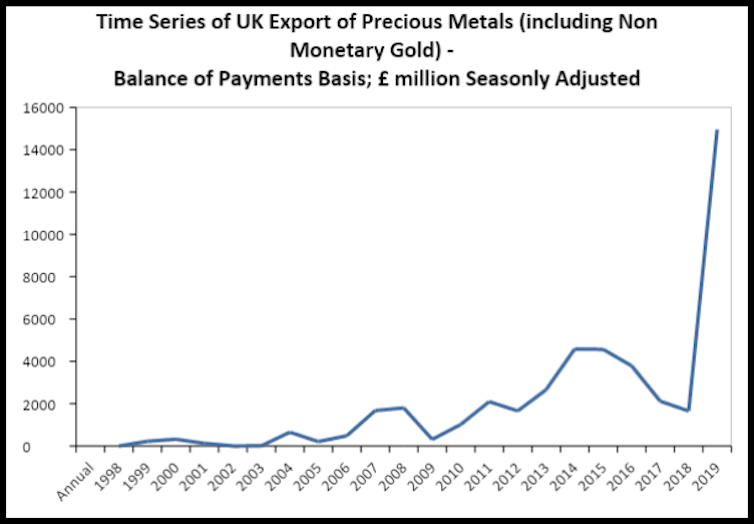
The ONS data tells us what precious metals the UK has been exporting since 1998. What we can see is a muted stationary average until 2019 when it skyrockets. The percentage change in November 2019, compared with the previous month was 856%. Likewise, November 2019 to December 2019 saw an increase of 103%. Compared with the three months previous, December 2019 recorded an increase in exports of just under 1000%.
This uplift above its trend equates to an approximate increase of £13bn – which in gross terms contributed to the UK GDP figures to the tune of a country the size of Latvia. Put differently, UK exports increased in the fourth quarter by the size of Botswana and Malta’s GDP combined. Overall, this is clearly unprecedented and, on the aggregate, is a data headline mover.

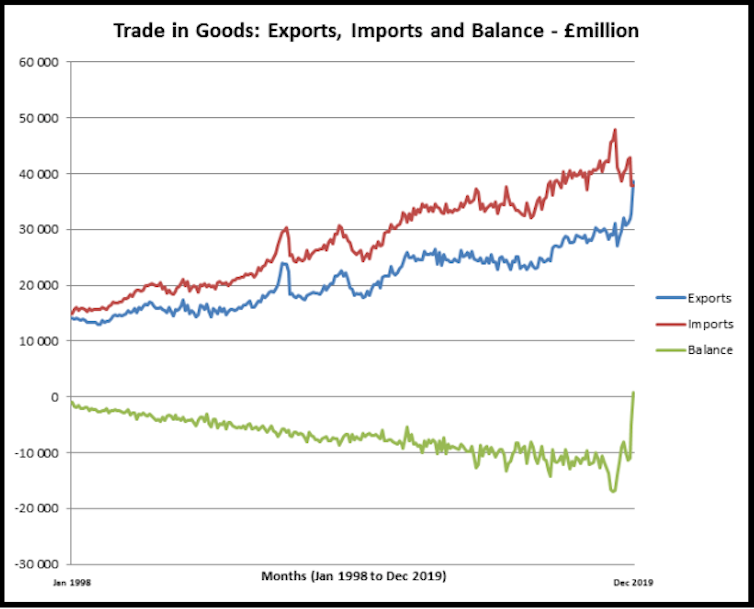
Other ONS data shows that from January 1998 the UK has always run at a deficit in respect to its trade in goods (combined with trade in services, the current account is always in deficit). December 2019 was the first time across this period that the UK ran a surplus in the trade of goods, and this also meant that the current account returned to a balance-of-payments surplus – and one of the biggest on record. This is a net contribution to real GDP.
What’s going on?
So has the UK become more competitive? Sadly, not. This is all due to a £13bn export in gold. This almost one-off export of gold has distorted UK trade figures. But why is the UK exporting such a large amount of gold?
Historically, the UK has always been the world hub for gold trading. In economics they call the UK a “terminal hub”. The UK does not mine any significant quantity of gold, yet London is the world’s hub for trade in physical bullion. Today it is estimated to comprise approximately 70% of global notional trading volume and trades in 400oz bars which are stored in the member vaults of the London Precious Metals Clearing Limited and the Bank of England.
So, given the dominance and opulence of gold bullion, any movements out of its world hub will significantly distort national trade figures. It is not yet clear what has caused this huge movement of gold – and often gold movements lack transparency for various reasons.
As there is no inclusion of “monetary gold” (central bank movements of gold) in these figures, it does not seem as though central banks, particularly the Bank of England, were selling off gold reserves to stabilise the pound in the run up to Brexit. Nor is there evidence of foreign central banks or private banks repatriating their gold portfolios to hedge against the election and Brexit risk.
It may suggest that investors still have confidence in the London Gold Market, but little confidence in the UK economy. Such a spike in exports could be an indication that traders were switching out of gold in the build up to Brexit D-day, or an indication that global inflation may be on the rise – but with a backdrop of poor global economic growth.
It could also be explained by accounting changes by a foreign firm which holds large stocks of gold in the UK (such as a bank). Banks can quite easily shift assets from one side of a balance sheet to another. But why? It may well be a nod to the fact that the UK is moving away from being a safe haven for foreign investors.
The real figures
What is most important is that UK national statistics are superficial and not representative of “real” economic changes. Truss’s claims about the economy exclude this precarious “export” of gold. If it had been taken into account, then the UK’s exports will have grown by 2.9%, not 5% – the lowest level since 2015.
The UK would have exported £676bn of goods and services, not £689bn. The exports of goods to non-EU countries could be estimated to be significantly less. According to the ONS data, UK export in goods traded with non-EU countries at current prices has increased by 490% on “unspecified goods”. The gold seems to have been exported to non-EU countries. Without the £12 billion export of gold, exports of goods to non-EU countries could be estimated to have increased by 6.2%, not 13.6%.
Whatever the driving force behind the gold bullion shuffle, stripping out the gold illusion reveals the modesty of the latest national statistics. So when it comes to the economic vital signs, the lesson here is to take them with a big pinch of salt.

