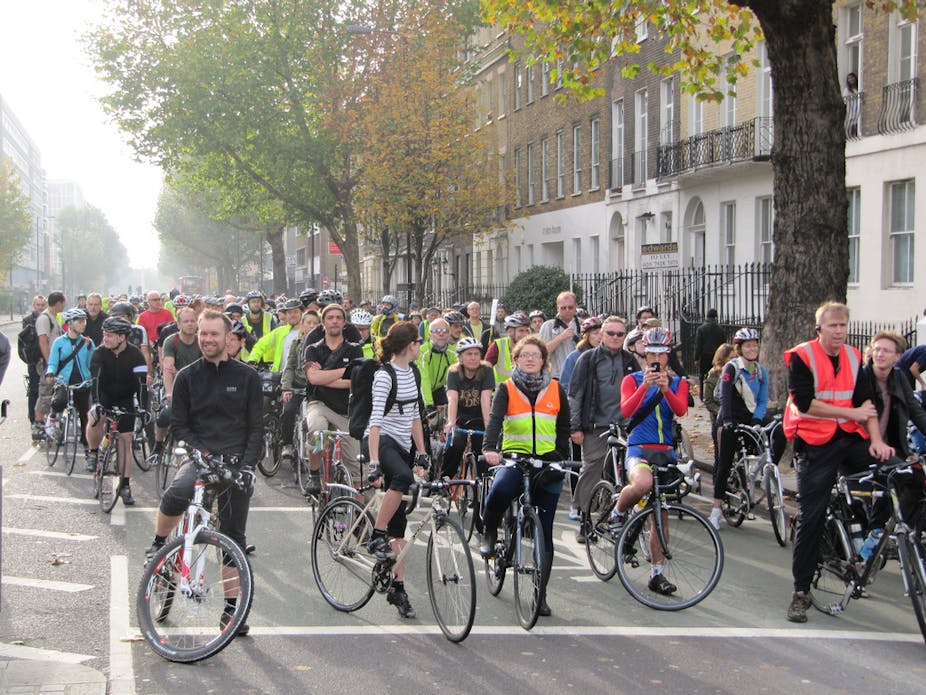
The parliamentary debate on cycling was a wake-up call to the government on cycling.
The coalition government has been floundering, with a botched timeline for release of their Walking and Cycling Delivery plan. In a dramatic and unexpected move, this was finally released just hours before the debate began. The report is weak, falling far short in a number of areas, particularly the £10 per head we need – although politicians from every major party gave heartfelt and articulate support for this proposal in the Get Britain Cycling (GBC) report.
As a Times editorial points out, this amounts to only 3% of the transport budget. With health, environment and congestion savings, it would almost instantly pay for itself.
Long-term bike benefits
Research by James Woodcock and me, commissioned for early release by the national cycling charity, CTC, was mentioned several times in the debate. The details of the report were designed to arrive at a simple outcome: quantifying the benefits of cycling in the long term, which was found to be in the billions of pounds for health alone, using World Health Organisation recommendations. The next step for the research is to identify other benefits. But what about the big picture – what does this research area mean for policy?
The next step for cycle campaigners is clear: lobbying politicians at all levels so that the “cyclist vote” (in reality, the pedestrian, elderly and young adult vote too – as we shall see) is heard loud and clear. As a publicly funded academic, my role in the debate is to provide evidence. In the era of “evidence-based policy”, a condensed nugget of hard evidence on the matter can be worth reams of rhetoric. As a point of departure, it is worth seeing what evidence was used in the debate and other areas where data can inform the debate.
Ian Austin MP commenced the debate by replying to the plan set out by Robert Goodwill, the parliamentary under secretary of state at the Department for Transport, about what we want for cycling:
We want 10% of journeys to be made by bike by 2025 – the figure was less than 2% in 2011 – and we call for lower speed limits in urban areas. We want more effective enforcement of the law, we want children to be taught to ride at school, we want more segregated cycle lanes, and we want cycling to be considered properly as part of the urban planning process. We also call for top-level, committed leadership, because cross-departmental collaboration is essential if we are to improve cycling conditions in Britain.
Never again let it be said that active travel advocates don’t know what they want: this is as good a summary as any of what is being called for, by a broad coalition of NGOs and civil society, from the CTC to the AA.
Simple mathematics
Returning to the evidence in the GBC report, simple mathematics shows that the “10% [cycling] by 2025” target is highly ambitious in the context of the longer-term “25% by 2050” target; the former implies a growth rate of 0.8 percentage points per year (from 2% to 10% in ten years) while the latter implies a lower growth rate of two-thirds of a percentage point per year (23 percentage points divided by 35 years – see figure 1 below). In other words, the GBC report recommends front-loading the uptake of cycling, concentrating this in the early period to 2025, which is certainly possible but which is not easy to model.
An additional issue with the above numbers is that we do not live in a linear world. Population ecology shows us that growth rates are often curvy (typically following some kind of s-shaped curve) and sometimes abrupt. As Rachel Aldred put it, quoting Carlton Reid, executive editor of BikeBiz magazine: “History teaches us that transport modes don’t just evolve, but can flip, and usually in the most unexpected ways.”
In my research with Woodcock, we translated this into a “logistic function” of cycling over time. This top-down approach builds on previous research, which projected the cycling rate in a single city to 2025. Applying the principle nationwide to 2050 was a greater modelling challenge, but the principle’s the same (see figure 1).

As is clear from the figure, we did not just select one future and stick to it: different scenarios reflect different possibilities for change. More importantly, the clearly defined timeline (the curves could be set to any shape, I would advocate faster growth to 2025 in order to meet the GBC scenarios) allows for yearly targets. Saying “by 2025” allows politicians to kick the issue into the long grass. With annually released surveys such as the National Travel Survey (NTS), we could hold politicians to higher and more specific targets, to see if we are on track or not.
Peak car use
This approach differs strikingly from the Department for Transport’s “predict and provide” approach, where increased driving is predicted. This comes despite real-time evidence of reduced car use and longer-term signs that we may be at or approaching the era of “peak car.” The DfT’s national model has recently predicted no growth in cycling to 2045. It urgently needs to be updated to take better account of shifting travel patterns.

It is only with a clearly defined vision of the future, contained in a transparent and reproducible model, that we can properly plan for an obviously uncertain future. Preferably this plan should be available to the public for testing with open-source software (the Department of Energy and Climate Change’s 2050 planning tool provides an excellent example of this).
With such a vision in place, planning for the provision for active travel and understanding of the benefits it brings can take place in an orderly way. This differs greatly from the government’s current approach on cycling which is “sporadic and episodic”, lurching from one scheme to the next.

