

According to some commentators, something quite strange is happening in the United States in the run-up to the midterm elections.
US president Barack Obama’s Democrats are heading for a clunking defeat while evidence seems to build of a robust recovery. This disjunction between economic performance and political success would seem to upend one of the great clichés of modern politics. These days it’s the economy, stupid – except when it isn’t.
To state it simply, the US economy is doing well, but most voters will go Republican. Irrational, no?
Fetishism
How do we explain this unexpected outcome, when, as Bill Clinton famously told one and all, when the economy goes well, voters are expected to reward the party of the president? Well, the Financial Times has hit the nail on the head with its analysis, and helps us to understand the apparent anomaly:
The US economy has grown but incomes have not – creating a mood of sour populism directed largely at Barack Obama that threatens to sweep Democrats from power.
Here we have a clear case of what might be called “GDP fetishism”, a perversion frequently practised by British Chancellor George Osborne when seeking to demonstrate his self-proclaimed success in reviving the British economy. As an editorial in the Guardian recently said, “Figures released on Thursday showed the US economy growing by 3.5% over 12 months”. But the writer neglected to ask the question, 3.5% for whom?
It’s the facts, stupid
For households, median income in 2013 was lower than it had been in 2007 despite a higher GDP (median income is the income level at the mid-point of the household distribution). Even more indicative of how bad things have been for the eponymous 99%, median income was down in 47 of the 50 states according to the statistics published in the FT article mentioned above.
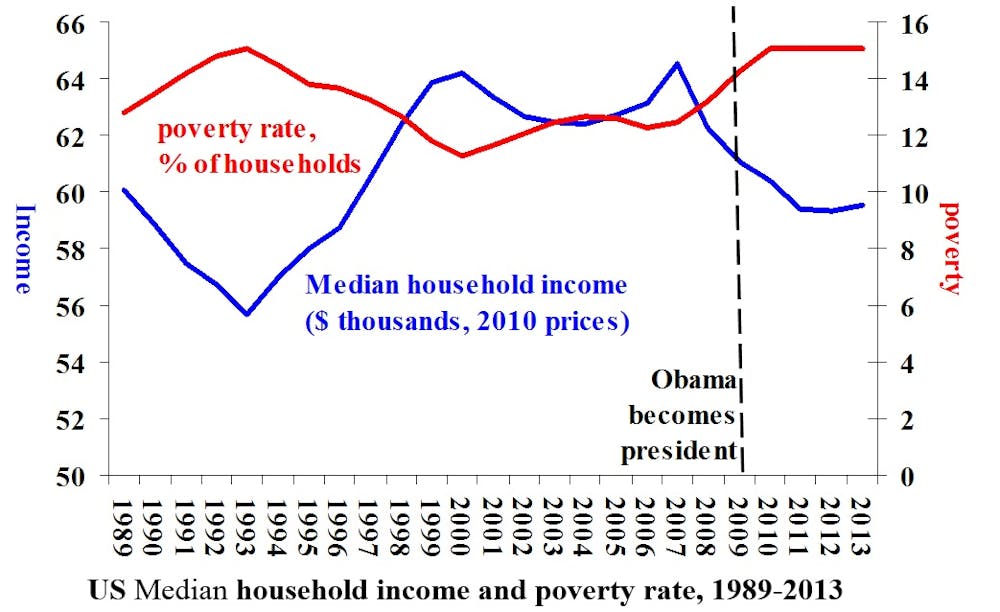
The longer-term statistics found in the annual Economic Report of the President reinforces the message from income by states. The chart below gives real median family income and the percentage of households in poverty for the United States as a whole, from 1989-2013 (1989 because it was the highest since the end of WWII).
After rising through the 1990s, the income of the median household stagnated during 2000-2007, then fell when the Great Recession hit – and the poverty rate rose. We learn that after Obama took office in 2009 median household income fell by almost 8% through 2013. Worth noting that unlike in the UK, where poverty is calculated relatively to average income, the US measure is for an income poverty line, an absolute measure.
Incoming!
The inappropriateness of GDP as the measure of the economic benefits to the vast majority is further demonstrated in the second chart. Over the 25 calendar years 1989-2013 GDP per capita rose by 37%. By contrast, the income of the “typical” (median) family crawled to 7% above its 1989 value at its highest, and during the Obama presidency dropped below where it was in 1989. Meanwhile, GDP per head rose by 7%.
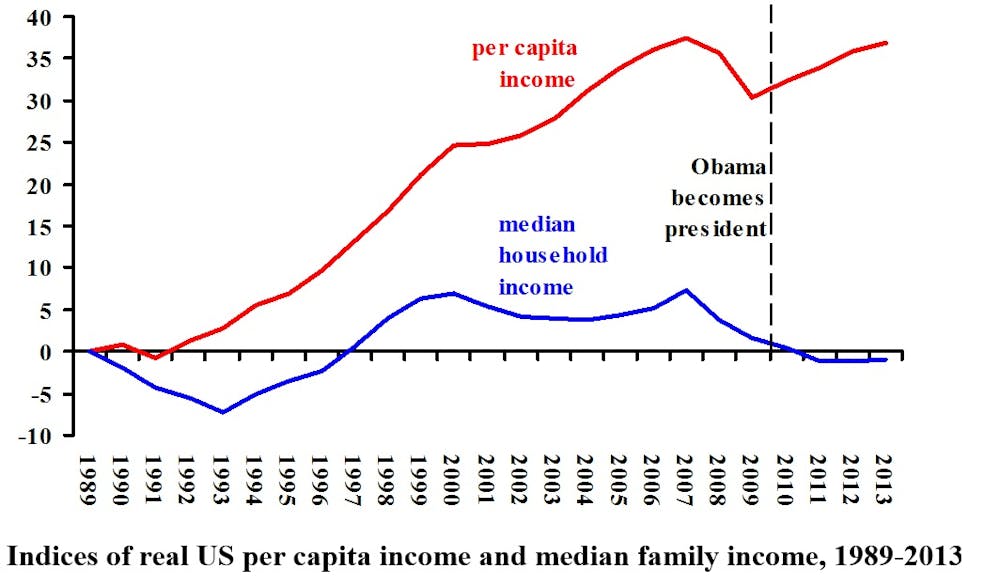
How can GDP per person rise and the income of the vast majority of the population decline? It’s the distribution, stupid. And those voters in the 99% know it. They are worse off, and as a result we face a high probability that Republicans will control both houses of Congress.
This article is part of an ongoing series, Beyond GDP, which looks at the dominance of GDP in economic thinking and how that might change. Read more here