


The latest data from the ONS show that the UK’s productivity gap with other G7 nations is at its widest since 1992. This bad news comes against the backdrop of increased optimism as the economy seems finally to have returned to growth. Unfortunately, this growth seems to be generated by Britain’s usual suspects: consumer spending and a booming housing market (stoked by government subsidies like Help To Buy) rather than from exports and investment. The danger is that a recovery without underlying productivity growth is unsustainable.
Is the modicum of good news a vindication of the chancellor’s austerity policies? Au contraire, George. The recovery (the slowest on record for the UK) has been in spite of, rather than because of, such policies. What is needed is renewed focus on raising productivity. Business investment is a crucial ingredient, and the government can do more to support this.
Illuminating the productivity puzzle?
The latest ONS figures show that in 2012 labour productivity as measured by output per hour was 21% below the G7 average (Figure 1, below) – the widest gap for 20 years. In output per worker terms, the gap was 25%. Moreover, output per hour in 2012 was 3% lower than in 2007, a full 16% below the level it would have been if long-term pre-2007 trends had continued. This lacklustre productivity performance since the financial crisis has been dubbed the “Productivity Puzzle” because such a fall has been unprecedented in post war UK history.

For many “supply-side pessimists”, this indicates a large and permanent loss to productivity. According to this view, output is very close to potential and so monetary and fiscal policy must be tightened.
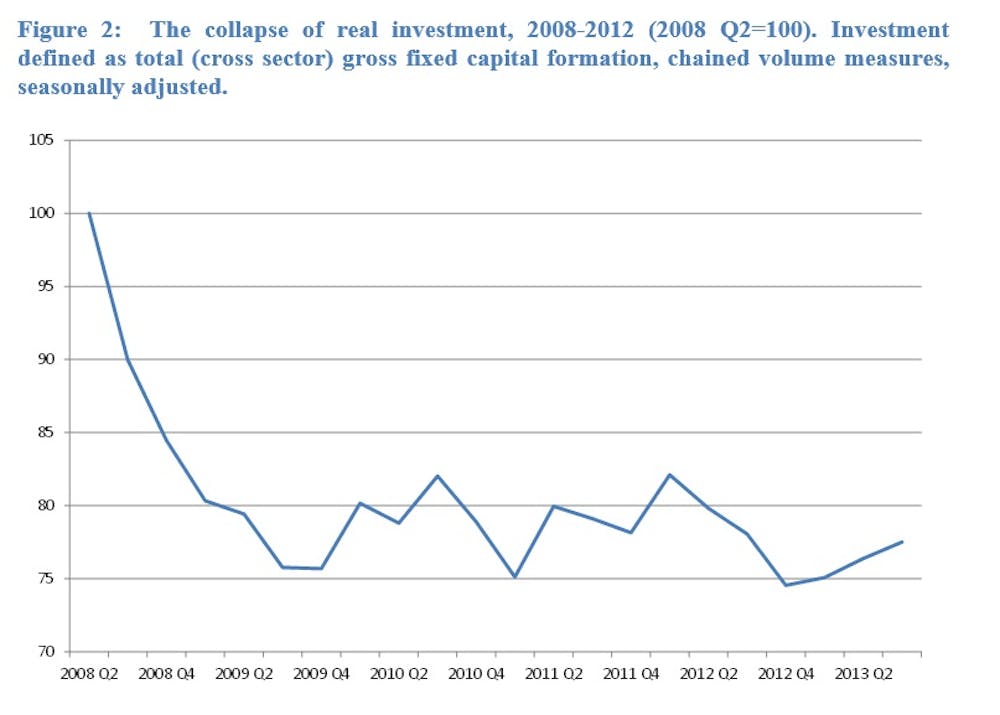
The flipside of the puzzle of low productivity is a jobs conundrum. Given that GDP growth has been so poor, it is remarkable that unemployment is not higher. Central to understanding this is the fact that UK real wages are far more flexible than in past recessions due to weakened union power and welfare reforms. In response to low demand, real wages have fallen by 8% since Lehman’s collapse (based on data to October 2013). This has helped keep labour costs low for employees and sustained higher employment. However, low wages and rising costs of capital due to banking dislocation have deterred business investment, as has high uncertainty and the disastrous decision to slash public investment by half. Figure 2, below, shows how real investment has collapsed since 2008.
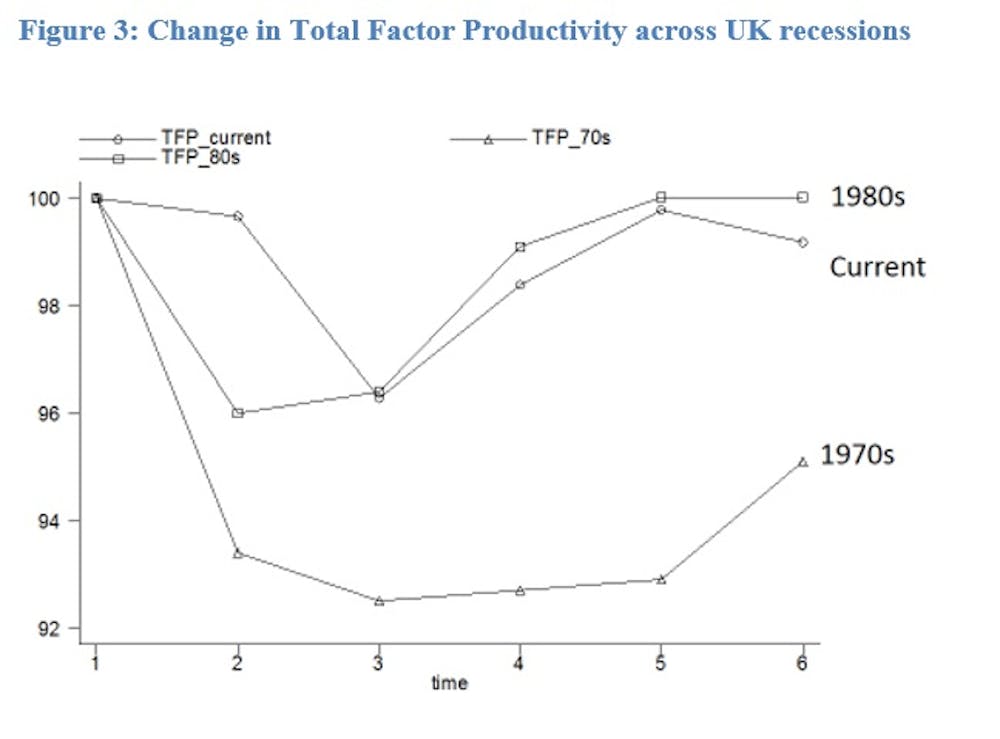
Lower investment can depress the amount of capital per worker and so will reduce labour productivity. Less machines per employee imply less output per employee. This “capital shallowing” is not a fundamental loss of efficiency – as demand improves and credit markets return to normal, productivity should rebound. A close inspection of the data, reveals that most of the fall in labour productivity can be accounted for by the fall in effective capital per worker (and to a smaller extent the fall in hours per worker). What remains is a measure of efficiency (sometimes called Total Factor Productivity or TFP), for which the trend is not so different compared to other severe recessions (see Figure 3, below).
Other factors may also matter for the recent productivity puzzle. They include the misallocation of capital due to forbearance (postponement of loan payments granted by lenders), mis-measurement of intangible assets and labour quality deterioration. But the underutilised resources caused by low demand and capital shallowing due to changes in the prices of labour and capital seem to explain a large chunk of the mystery.
The LSE Growth Commission has shown that there is underlying strength in the UK economy built up since the early 1980s when the UK reversed a century of relative economic decline. Productivity growth in the three decades leading up to the crisis was broad based with finance only contributing around a tenth of the improvement. Much of these improvements were due to policy reforms strengthening competition in product and labour markets, the benefits of which are unlikely to suddenly evaporate.
Unbalanced recovery
So the story of the supply-side pessimists doesn’t stack up.
If the demand side is important, then excessive austerity may have led to a slower recovery with the risk of permanent structural damage. Regardless of how we may quantify this lost growth (for example the Jorda and Taylor estimates), the important fact is that we could have done a lot better.
Business investment has stayed flat: the latest ONS data show that while business investment rose 2% in Q3 2013 compared to the previous quarter – it was 5.3% lower than Q3 2012.
Distortions with our financial sector still remain – lending to companies has not picked up, despite favourable credit conditions and lower funding costs for banks. Banks are attempting to rebuild their balance sheets, which has made them reluctant to lend, and enforce covenants over bad loans. The result: insufficient capital is flowing to high growth potential enterprises.
Long term, pro-growth policies
Most of the recent falls in productivity are due to temporary factors such as weak demand and financial sector turmoil. Poor fiscal policy and a failure to adequately address banking problems has exacerbated these problems, but cannot hold back the rebound indefinitely.
This should not make us complacent over productivity. There was a significant gap with our peers prior to the crisis which held back living standards as can be seen in Figure 1. We need to focus on strengthening the foundations of the UK through long-run investments in infrastructure, skills and innovation along the lines set out by the LSE Growth Commission.
Cutting public investment in a depression is bad short-term macro policy as well as foolish long-term growth policy. In political terms it made sense – cuts in investment are bruises that are not usually seen in public. That is, until many years later or, in the case of flood defences, when the rain starts falling.