

If you use a car to get around, every time you get behind the wheel you’re confronted with a choice: how will you navigate to your destination? Whether it’s a trip you take every day, such as from home to work, or to someplace you haven’t been before, you need to decide on a route.
Transportation research has traditionally assumed that drivers are very rational and choose the optimal route that minimizes travel time. Traffic prediction models are based on this seemingly reasonable assumption. Planners use these models in their efforts to keep traffic flowing freely – when they evaluate a change to a road network, for instance, or the impact of a new carpool lane. In order for traffic models to be reliable, they must do a good job reproducing user behavior. But there’s little empirical support for the assumption at their core – that drivers will pick the optimal route.
For that reason, we decided to investigate how people make these choices in their real lives. Understanding how drivers build a route to reach their destination will help us gain insights into human movement behavior. Better knowledge of individual routing can help improve urban infrastructure and GPS directions systems – not just for one driver, but for everyone. Beating congestion is a big goal: one estimate put the cost of traffic in 2014 at US$160 billion in the U.S., with 42 extra hours of travel time and $960 worth of extra fuel for every commuter.
How do people really go?
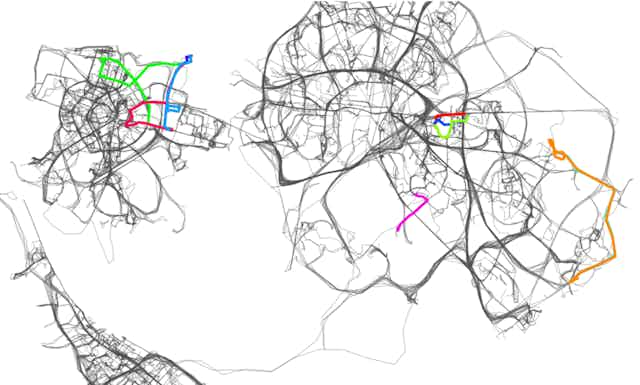
Using GPS data collected for several months for hundreds of drivers in four European cities, we studied individuals’ routing behavior, looking for interesting patterns in their choices.
We discovered that people use only a few routes when moving between their relevant places, even when those trips are repeated again and again over extended periods. Most people have a single favorite route for trips they perform routinely and a few alternatives routes they take less frequently to the same destinations.
So did people in fact usually choose the optimal route?
In short, no. It turned out roughly half of the favorite routes are not the optimal routes suggested by navigation devices, such as those offered by some popular mapping apps for smartphones. If we also consider drivers’ alternative choices, even fewer routes are optimal – only a third overall minimize travel time.
Our data provide empirical proof that drivers are not taking the optimal route, directly contradicting the shortest travel-time assumption.
Why would drivers take a nonoptimal route?
What’s behind this result? A unique answer that is valid for every driver won’t be easy to find.
Prior small-scale studies found that many factors, some seemingly minor, might influence route preference. For example, people tend to choose routes going south rather than routes of equal lengths that go north. People favor routes that are straight at the beginning, instead of shorter ones that aren’t straight. Landmarks also influence route choice, by attracting more trips than travel-time minimization would expect. A novel app for iPhones builds on that very concept and allows people to find the most “interesting” route between two points.
People might not be able to determine which route is optimal, among all possible choices, because of limited information and limited ability to process big amounts of information. Or, even if they can, people might deliberately make different choices, according to personal preference. Many factors can influence preference, including fuel consumption, route reliability, simplicity and pleasure.
Drivers’ apparent flexibility on route choices may provide an opportunity to alleviate overall congestion. For instance, smartphone apps could offer points and vouchers to drivers who are willing to take longer routes that avoid congested areas. Navigation app Waze has already changed drivers’ habits in some cities, so it’s not so far-fetched to imagine a gamification system that reduces congestion.
How far from the best route are we?
For our next study, rather than trying to understand what drives individual route choices, we aimed to quantify how far those choices are from optimal.
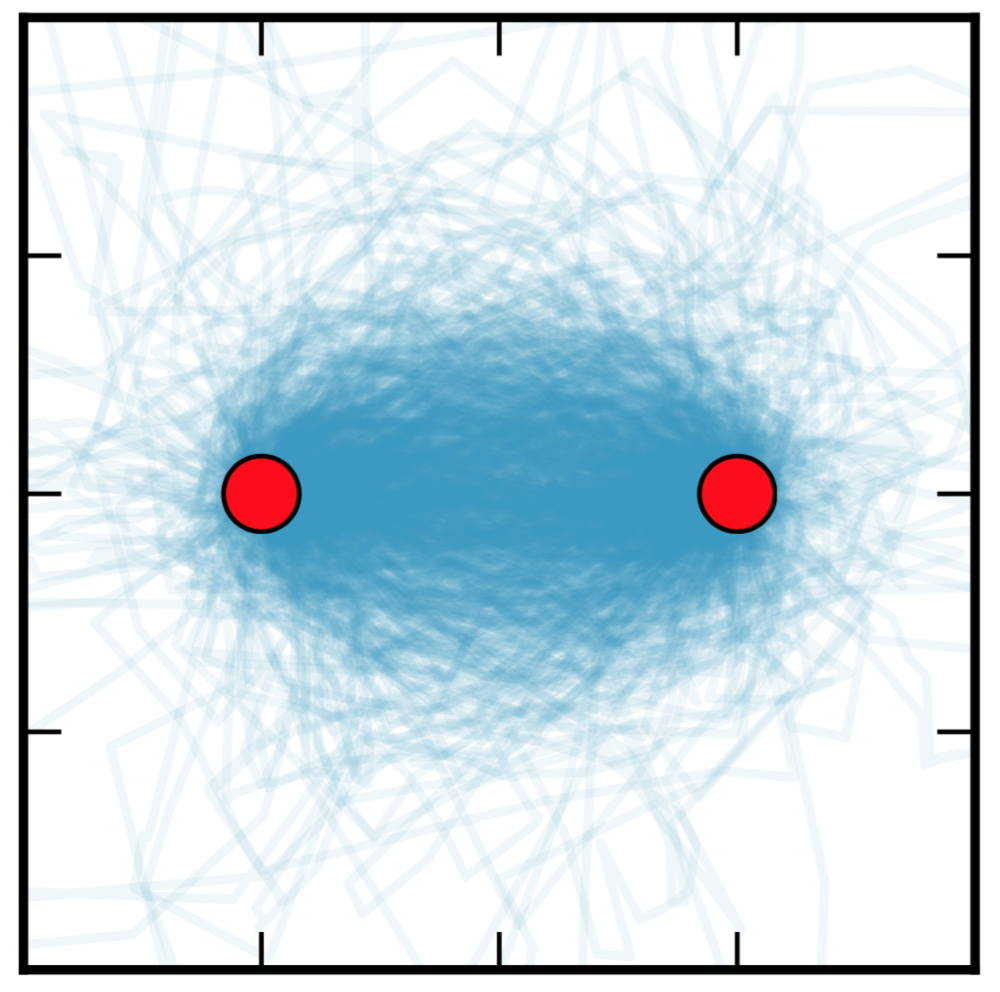
It’s hard to directly compare all the different trips undertaken in a city, because they involve many locations and are different in length. To make this task easier, we transformed trajectories so that they all look alike, regardless of their actual source, destination and length. We rotated, translated and scaled each route so that all trajectories would start and finish at the same two points in a new reference system. After this transformation, all the routes look as if they spanned the same two points; they all look similar in length, but their shape is preserved. What we found by plotting a sample of the transformed routes was the intrinsic variability in human routes.
Intriguingly, our abstraction of all the trips sort of looks like a magnet’s force lines, with the routes’ origins and destinations in place of the magnet’s north and south poles. By analyzing a density plot of the transformed trajectories, we found the vast majority are fully contained within an ellipse that has the same shape independent of the scale, with the start and endpoints as foci. This ellipse effectively makes up the boundary of human routes.
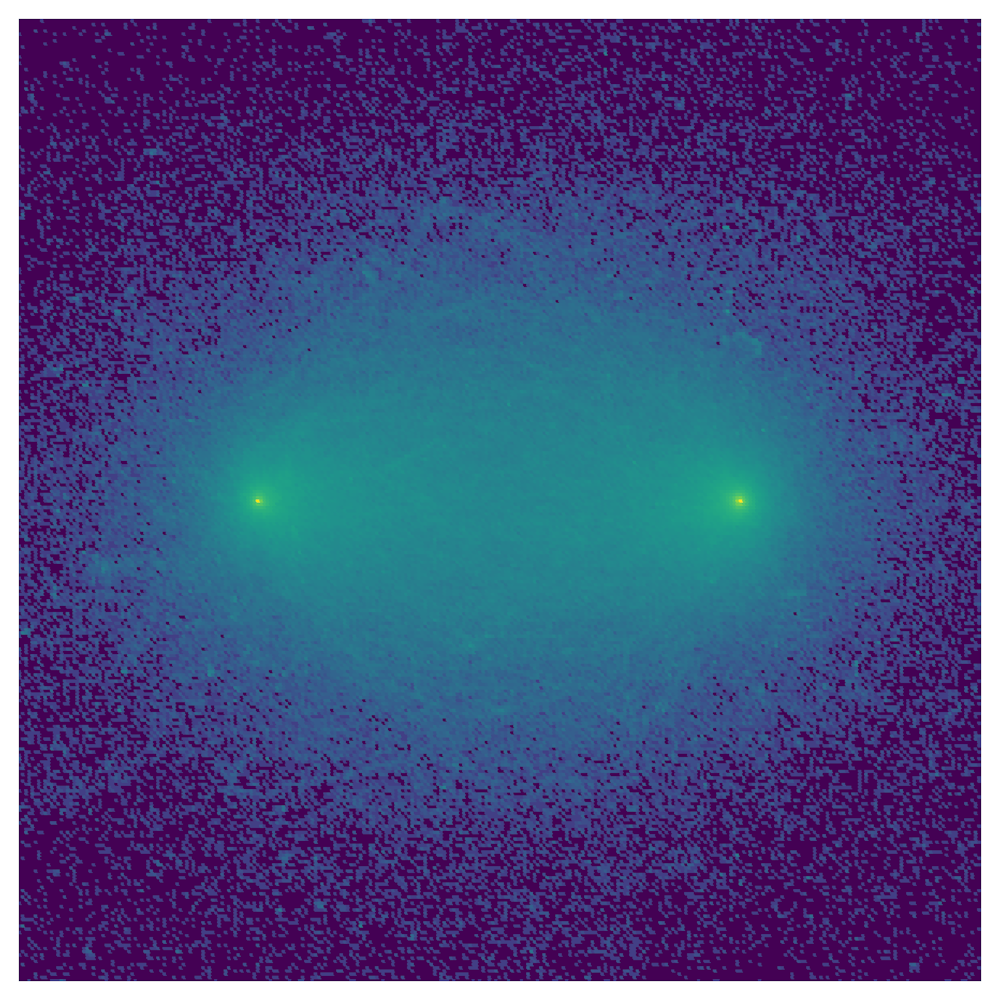
The ellipse also helps us measure how direct a route is. The ellipse’s eccentricity tells us how elongated it is. An eccentricity close to 1 means the ellipse is similar to a line (high width and low height), while an eccentricity close to 0 means it is similar to a circle (width and height roughly similar).
Generally, a straight route is not a viable option because of physical obstacles, such as buildings. Drivers deviate from that idealized shortest path according to the street network and personal preferences. While these two phenomena are hard to model, we found that they are bounded by a ellipse of a particular shape, having a high eccentricity equal to 0.8.
To our surprise, the observed shape of the ellipse did not change with distance between the endpoints. It looks like in an urban setting, drivers are willing to take detours that are roughly proportional to the distance between their starting point and destination. Routes that involve bigger detours are simply not taken, or split into two separate trips.
Our study uncovered basic rules of a realistic routing model that captures individual behavior in a urban environment. These findings can be used as building blocks for new routing models that better predict traffic. And now that we know drivers have some quantifiable flexibility in their routes, we can use this information to design incentive mechanisms to alleviate congestion on busier roads, or carpooling plans based on individuals’ preferred routes.