

Socially and politically, 2016 was a momentous year for Britain. It was also a record breaking year for energy and the environment, but thankfully for all the right reasons. Britain’s electricity was the cleanest it had been in 60 years, as coal collapsed and renewables rose to record levels.
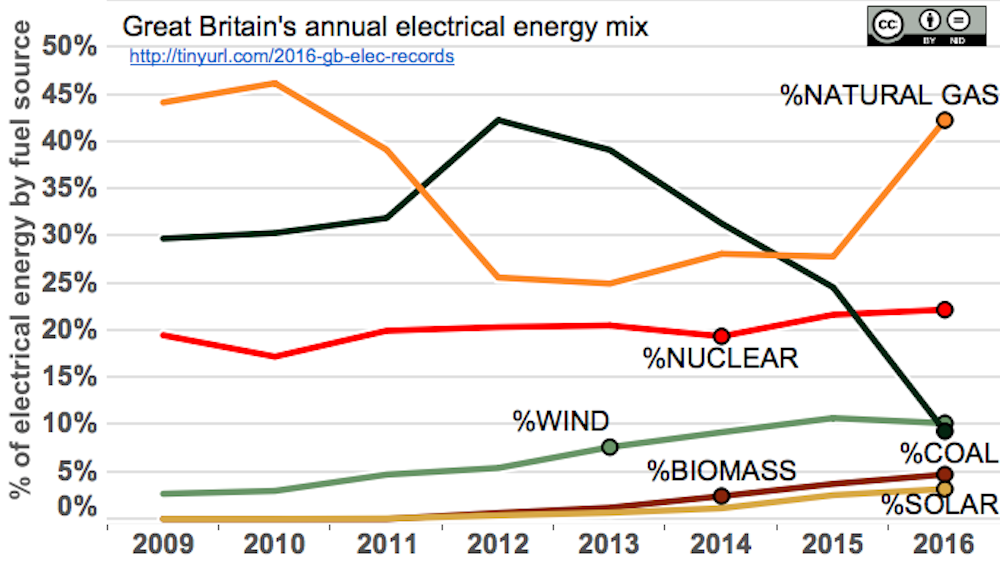
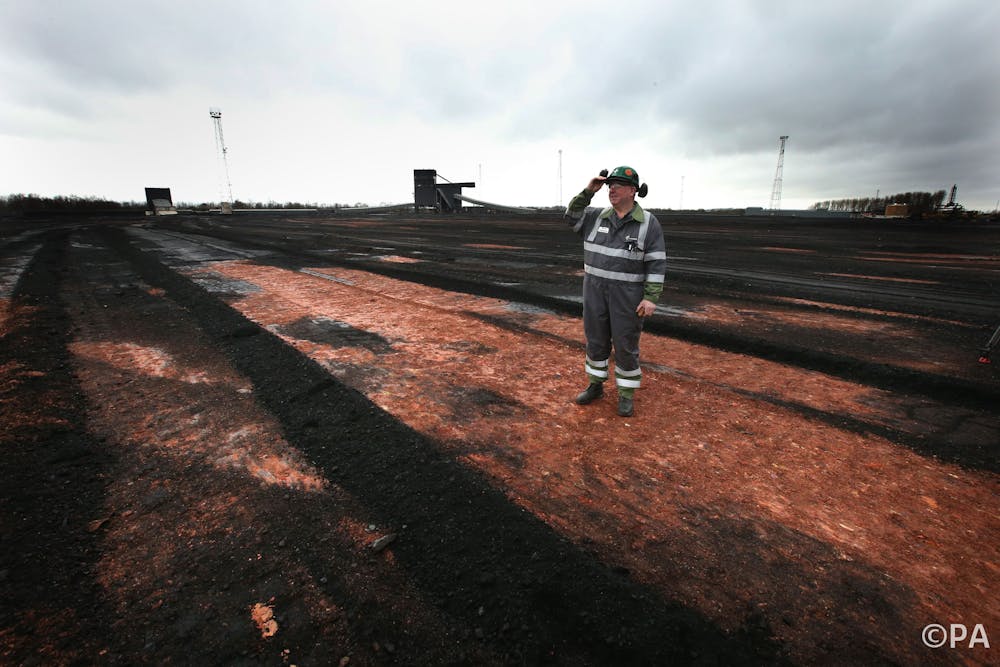
In 2016, just 9.3% of British (not UK – as Northern Ireland is calculated separately) electricity was generated from coal, down from more than 40% in 2012. This is the lowest share coal has ever provided in the system’s 100-plus year history, and the lowest absolute quantity burnt since the start of World War II.
In fact, at 10.2% of generation, wind farms produced more electricity, a significant milestone in Britain’s low-carbon transition. Natural gas has picked up most of the slack and posted its best year since 2010; but nuclear, solar and biomass are all also on the rise.
The demise of coal means British carbon emissions from electricity generation have halved over the past four years. This is not greenwashing or creative accounting. When factoring in the emissions released abroad from producing electricity and biomass that is then imported, Britain’s electricity sector released 82.4m tonnes of CO2. The last time annual emissions were below 100m tonnes was back in 1955.
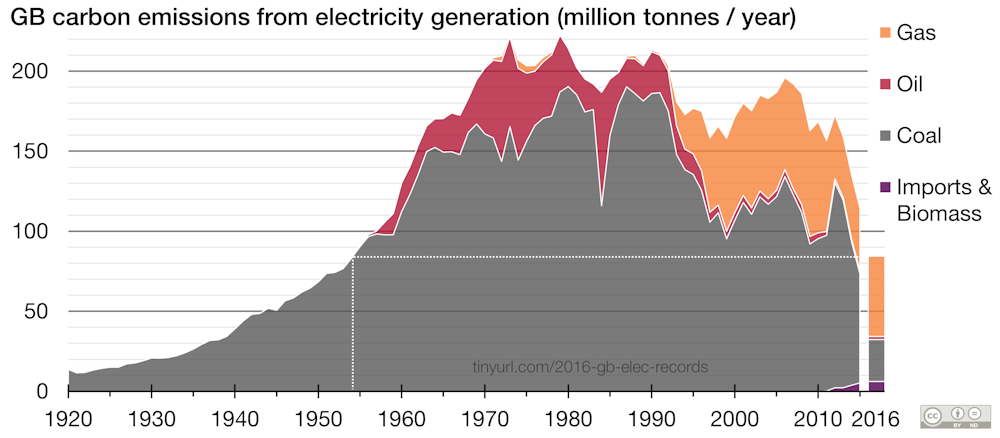
Emissions were 25% lower than in 2015, so changes in the electricity mix mean that each Briton effectively produced 400kg less CO2 – without lifting a finger. The carbon content of a unit of electricity has fallen to 277 grams per kWh, beating the strict pathway set out in the Climate Change Act’s Carbon Budgets by up to four years.
The coal collapse led to a number of other milestones being reached, including solar generation being greater than coal over the months of May, July and August. For the first time since the national grid was established in the 1930s, there were times with no coal generation at all. After first occurring on May 10, there have now been 200 coal-free hours. Scotland’s power sector is now entirely coal free, after its last station at Longannet closed in March.
Electricity demand continued its downwards trend, and now stands 20% lower than its 2005 peak, despite the population rising by 5m in that time. Demand is therefore back to levels seen in the late 1980’s, which also contributed to reduced fuel burn and reduced emissions.
Wind had a solid year, but annual output fell slightly as the number of storms of late 2015 were not repeated in the 2016 winter. Additional wind farms were deployed, and Britain’s capacity reached a new high of 14.33 GW. This meant that, during Storm Barbara just before Christmas, wind was able to set new records for weekly, daily and hourly output, peaking at 5.30pm on the December 23 when it generated 10.7 GW of electrical power (nearly a quarter of the national total at a peak time of day and year).
Solar also had a solid year, with installed capacity surpassing the 10 GW mark, despite fears about subsidy cuts. Throughout the year it amounted to 3.2% of all British output, though at its peak on May 12 it nearly reached 20%.
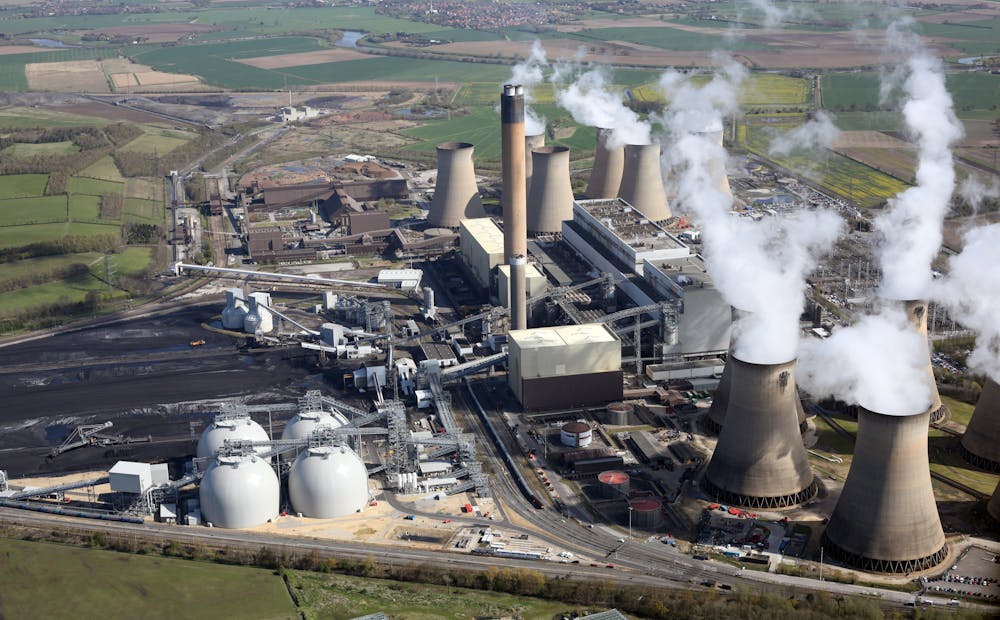
Biomass also posted its highest ever output at 14,198 GWh over the year, up 25% on 2015, and almost double its output in 2014. Output should continue its upwards trend now that the third coal unit at Drax power station in Yorkshire has permission to be converted to biomass (this means it will burn wood pellets imported from the US – a practice more sustainable than it sounds).
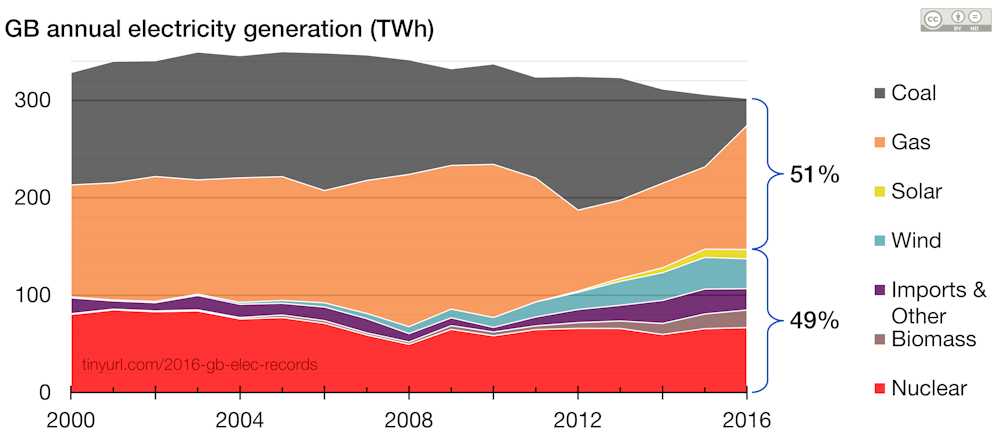
Renewables have seen a dramatic rise in Great Britain, with just over 28 GW of wind, solar and biomass installed – around 1 kW for every household. This is five times more than just five years ago, and as of December 2016, Britain has more renewables (combined) than any other type of generation, beating even gas turbines.
Putting together renewables, nuclear, and imports from France (which are almost all nuclear and hydro), Britain hit the milestone of supplying more than half its electricity from low carbon sources in the summer of 2016, up from 20% in 2010.
It seems Britain’s low-carbon transition is proceeding at full force. Renewable capacity and output are breaking new records, a combination of carbon taxes, fuel prices and clean-air legislation have forced coal down to levels not seen for two generations, and demand is falling thanks to improving energy efficiency. After a decade of relative stagnation in the 2000s, the 2010s have marked a dramatic shift, resulting in emissions halving in just four years. A bit of good news to start 2017.
The data used in this article is based on the Energy Charts and Electric Insights websites, which allow readers to visualise and explore data on generation and consumption from Elexon and National Grid. Data from other analyses (such as BEIS or DUKES) will differ due to methodology, and particularly by including combined heat and power, and other on-site generation which is not monitored by National Grid and Elexon. Our estimated carbon emissions are based on Iain Staffell’s research published in Energy Policy, and account for foreign emissions due to electricity imports and biomass fuel processing.