

As part of his presentation on Wednesday of a decidedly pedestrian budget, George Osborne managed to grab headlines with the claim that his policies have brought a rise in living standards. The chancellor presented “real household disposable income” as the most up-to-date and comprehensive measure of living standards and told listeners (and House of Commons dozers) that:
On that measure I can confirm, on the latest OBR [Office for Budget Responsibility] data today, living standards will be higher in 2015 than in 2010. And it confirms they are set to grow strongly every year for the rest of the decade.
There are two major shortcomings of his “most up-to-date and comprehensive measure”. First, it does not account for indirect taxes, in other words VAT, which is subtracted from disposable income to obtain “post-tax income”. It also fails to include any non-cash benefits, public or private.
Delivering benefits
For the average household in the fiscal year 2012-13, post-tax income was 19% less than disposable income. And for the average household, non-cash benefits raised post-tax income by about 25%, taking us overall to a level of 3.5% above disposable income, and to a figure the Office for National Statistics describes as “final income”. But those benefits, including health, education and social services, have since suffered substantial cuts from a chancellor delivering austerity medicine.
This effect flows from reductions in NHS funding resulting in less or slower access to care; the astronomical increase in the private cost of higher education; and the reduction in social workers across a range of services, most notably for young people. The National Association of Welfare Rights Advisers has a quick-reference table explaining most of the cash and non-cash benefit cuts.
So, the issue is not whether one income measure is larger or smaller than another, but whether the relevant one has gone up or down. It is likely that the really relevant number, final income, has indeed increased by less than disposable income because of those cuts in social services and the increase in VAT. In other words, the chancellor chose a measure to his liking.
A defence that argues, “well, depends on how you measure it” does not wash. Household “living standards” by any reasonable definition should exclude all taxes (not just income taxes as for disposable income) and include non-cash benefits. There are better measures than “final income”, but it is indisputably superior to disposable income.
Pay rewards
But, let’s grant the chancellor his measure and take a look at it in the chart below, which shows percentage point differences in real per capita disposable income compared to the second quarter of 2010 when he moved into 11 Downing Street.
The first thing to note is that disposable income collapsed during the first six quarters of the coalition government, briefly recovered in mid-2012, then collapsed a second time. Finally, it began to rise, almost returning to its level in the second quarter of 2010 at the end of 2014 (but not quite, still down by 0.3%).
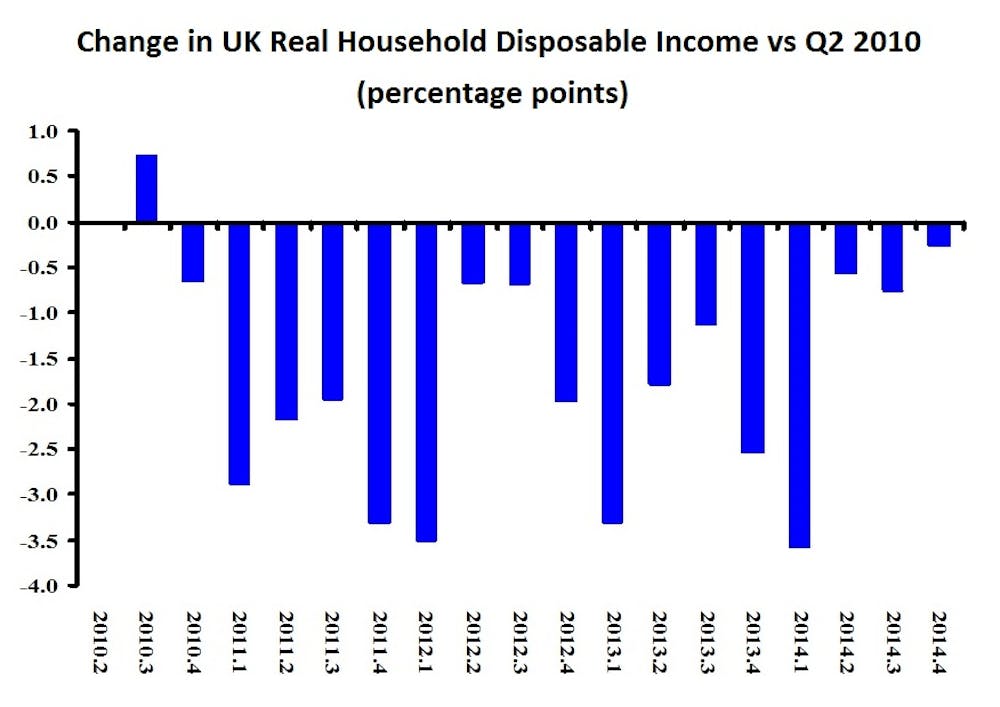
Thus, the chancellor’s legitimate claim is that he brought real per capital disposable income back to where it was when he took office – and he needed almost five years to do this. If the economy grows during 2015 at approximately the rate the chancellor announced in his budget speech, he can claim he achieved a 2% improvement in household income in five and a half years.
In 2010, if Osborne had offered UK voters an increase in real income of 2% in the waning moments of the coalition’s five years, few if any would have been impressed. This nothing-to-brag-about performance is easily explained. As of January this year, real weekly earnings in the private sector rested at a full 5% below their level in April 2010 (details in the ONS Economic Review March 2015), a decline intimately linked to austerity policies (but that’s for another article).
Wages down, household income stagnant for five years. Any more good news for households, George?