
The world’s leading scientists, politicians and even the pope are agreed that the world is warming thanks to human activities. Yet despite this, extreme cold weather still happens. The unusually chilly UK winter of 2009/10, for instance, led to understandable scepticism from some commentators who argued that this “global cooling” conflicted with predictions of warmer winters.
There’s no contradiction – the world simply doesn’t work like that. In fact, even after another 85 years of global warming there will still be a small chance of a 2009/10-style winter – a 0.6% chance, to be precise.
That’s according to new research by the UK’s Met Office which assesses how likely these sorts of unusual seasons will be in future. The study, published in the journal Nature Climate Change, also says the chances of the sort of historically hot summer that we might currently see only once every two decades will rise to 90% by 2100. What we would today consider a wetter-than-average summer will, by 2100, be relatively rare – just a 20% chance.
Importantly, these projections are expressed as probabilities. Climate is most commonly defined by the long-term average of the weather, typically temperature and rain or snowfall, taken over a 30-year time period. This way long-term trends, such as anthropogenic climate change, don’t get lost in the “noise” over much shorter periods.
But it’s equally important to assess how variable the weather is. When predicting the long-term effect of climate change it’s necessary to figure out not just what the “background” climate will look like, but also how common freak events, seasons or even years might be. An “average temperature rise of 2°C” isn’t much use to someone working in disaster management, for instance – they need to know whether to prepare for frequent heatwaves, floods or snow.
The Met Office uses a climate model known as HadCM3 to make long-term predictions. In this study, several hundred slightly different versions of the model were run to help represent uncertainty in the atmosphere and ocean climate system, for instance in winds and temperatures. The models were also run backwards in time and were assigned degrees of reliability according to their ability to simulate recent climate changes.
The results give a sense of short-term unpredictability of the weather in any given year, rather than merely highlighting what a “typical” year might look like – something not helped by the usual portrayal of projected temperature trends as a smooth line.

The cold 2009/10 winter is a good example of year-to-year variability that bucks the trend. The same confusion can happen in shorter timeframes – in the US, Senator Jim Inhofe brought a snowball into congress after it snowed last February to “prove” the world wasn’t getting warmer.
Freak events or even entire seasons don’t invalidate the kind of thorough projections described above. Climate scientists define the norm as within the 2.5-97.5 percentile range, yet these are just probabilities – and 5% of the time anomalies outside that range are expected to occur. The record-breaking winter of 1962/63, the UK’s coldest of the 20th century, or the wet winter of 2013/14 that caused major flooding, simply represent seasons that will only crop up a tiny fraction of the time.
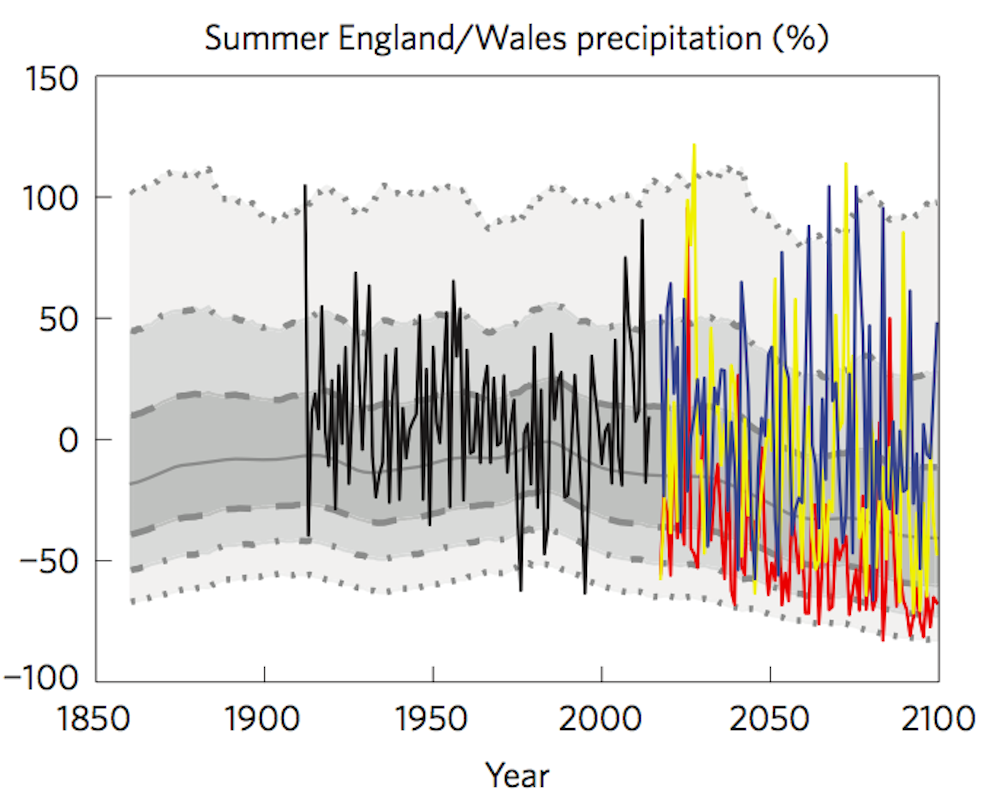
Even a series of seemingly unusual events doesn’t necessarily mean the “background” has changed. England and Wales had a series of wet summers from 2007 through to 2012, which were part of a rising summer rainfall trend after several years of relative “drought” conditions in the 1990s –- a rise that actually goes against long-term predictions of drier summers.
But on the chart below we can see these wet summers are still within the upper shaded grey region (the 2.5-97.5 percentiles) of the probabilistic projections and we can therefore attribute these summers to short-term variability, or noise, in the climate system.
Climate models don’t always capture the amount of year-to-year variability we actually observe in reality, so sometimes they need rescaling. And this variability itself may change over longer timescales, for example the North Atlantic Oscillation (a seesaw of atmospheric surface pressure across the North Atlantic) has become much more variable in winter over the past 50-100 years.
Models are also rather poor at capturing fluctuations in the all-important jet stream which is crucial for simulating precipitation and temperature changes over the British Isles.
Nevertheless, despite some remaining provisos, climate models are an indispensable tool for making predictions, and this new Hadley Centre study is a thorough new benchmark for all those concerned with the impact of climate change in Britain.