

How we track our economy influences everything from government spending and taxes to home lending and business investment. In our series The Way We Measure, we’re taking a close look at economic indicators to better understand what’s going on.
Consumers are key players in the economy, they purchase goods and services, supply labour and make savings and investment decisions. Hence, their sense of what’s happening in the economy has a flow on effect.
If they feel confident, they might spend a bit extra or go into debt. If they don’t, they won’t leave their job to start a risky venture.
Surveying how consumers feel, then, can provide a useful snapshot of how an economy is faring right now, and in the near future.
The survey
The idea that consumer confidence - optimism or pessimism – is important for real activity dates back to the Great Depression and John Maynard Keynes. The University of Michigan Survey of Consumers – the first of its kind, was designed in 1946 to track changes in consumer confidence.
The Australian version of the Michigan survey – the Melbourne Institute Consumer Attitudes, Sentiments and Expectations (CASiE) survey began in March 1973. The sample size comprises 1,200 households and is sorted by age, gender and state so that it is representative of the Australian population.
The CASiE survey contains five core questions. Consumers are asked about:
- their family finances compared to 12 months ago
- their expected family finances in the next 12 months
- expected economic conditions in the next 12 months
- expected economic conditions in the next five years
- whether it is good/bad time to buy major household items.
The answers are ordinal, such as “better-off”/“good”, “same”, “worse-off”/“bad” or “don’t know”.
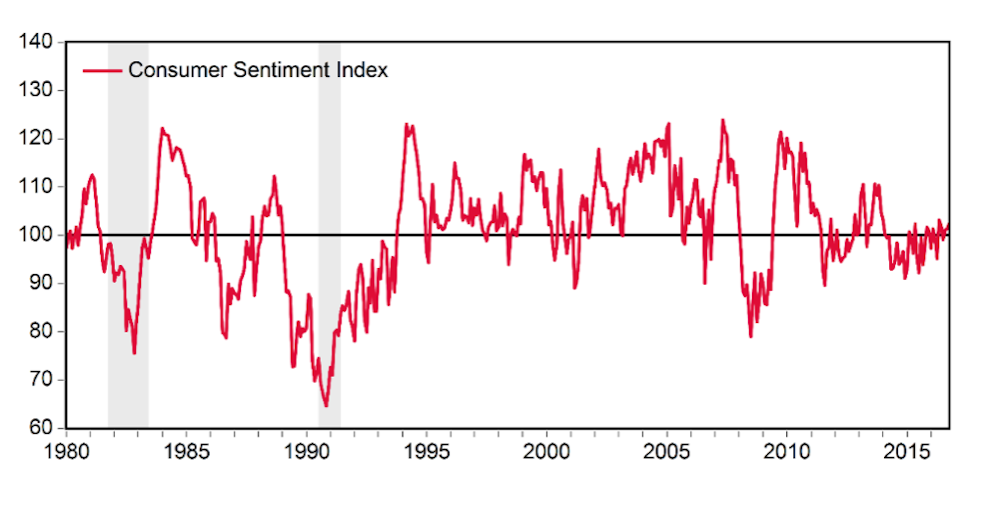
The responses to these five questions are used to construct five component indexes, one for each question. The Westpac-Melbourne Institute Consumer Sentiment Index is a simple average of these five component indexes. 100 is the neutral mark, a value greater than 100 indicates that optimism outweighs pessimism and vice versa.
What the survey shows us
Since its introduction, the Westpac-Melbourne Institute Consumer Sentiment Index has served as a reliable and timely indicator of economic activity in Australia. Swings in consumer sentiment, as displayed in this first chart, have proven valuable in signalling major turning points in the Australian business cycle such as the early 1980s and 1990s recessions.
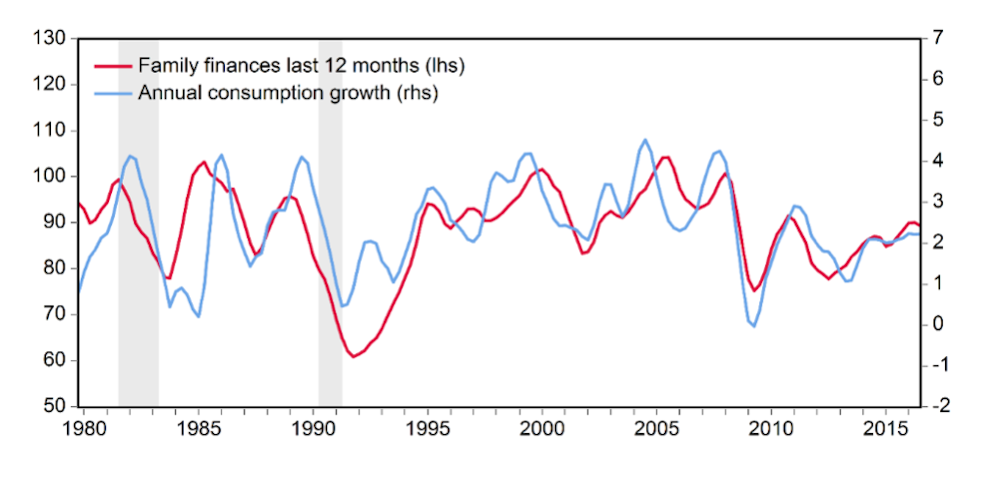
Importantly the consumer sentiment index embed both coincident and leading information about current and future real economic activity. In particular, the index relating to family finances over the previous 12 months is a timely indicator of changes in real consumption patterns.
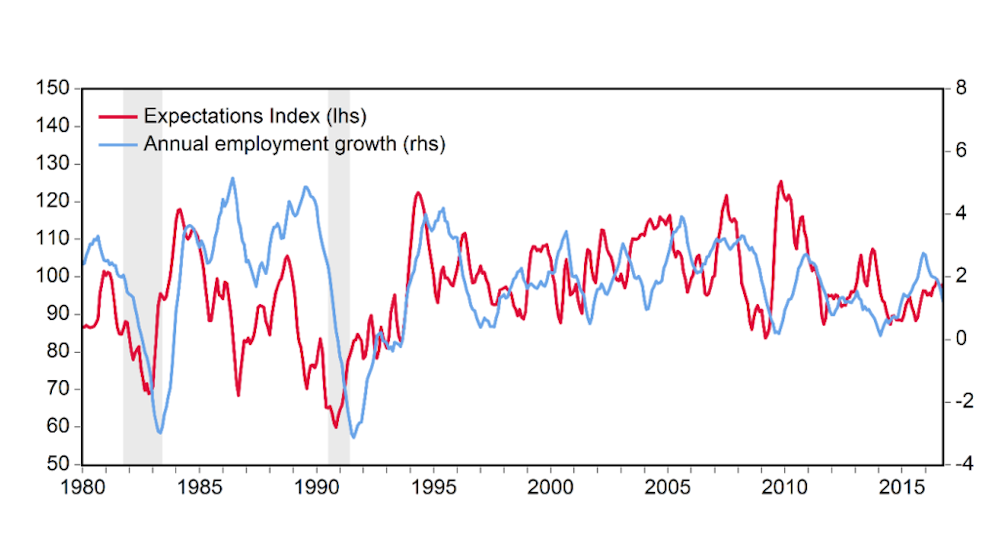
Meanwhile, the expectations index, constructed as an average of three forward-looking components (relating to family finances over the next 12 months, economic conditions over the next 12 months and the next five years), appears to be a reliable indicator of future real activity. For example, it has consistently foreshadowed important changes in Australian labour market conditions.
Changes
Over its long history, the CASiE survey has also evolved gradually to keep up with changes in technology and demographics. Traditional face-to-face interviews were replaced with telephone interviews in the early 1990s and online surveys have been recently introduced to complement telephone ones.
The decreasing cost of internet usage and the increasing influence of personal mobile devices, such as smartphones and tablets, appear to have improved the flow of information. With easier and faster access to news, consumers appear to be more informed about current affairs.
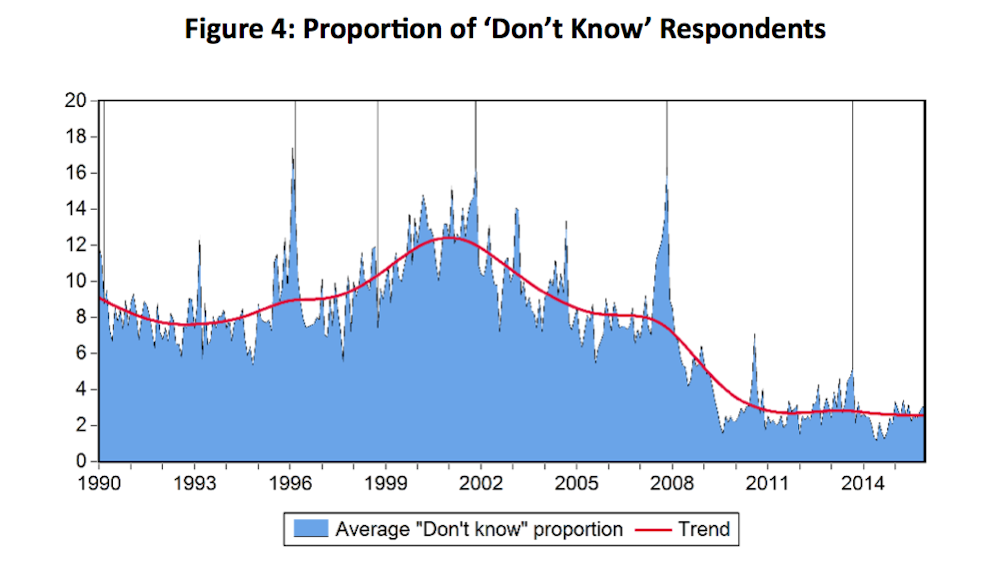
The average proportion of interviewees replying “don’t know” to the five survey questions used to be around 9% during the 1990s and through to the mid-2000s. This proportion, however, has declined gradually since the introduction of smartphones in 2007 and recently has plateaued to around 3%.
In the future, new innovations and advances in information technology will likely help reduce the cost even more. But increasing the frequency of surveys may not be beneficial as they will likely capture more randomness. Research about how people form expectations suggests consumers tend to update their expectations every six to twelve months and most consumers’ current and future family financial conditions are unlikely to change on a weekly or daily basis.
Over the years, the consumer sentiment index has attracted the attention of policy makers, market economists and academics, mainly because it is a useful signal about future household consumption and saving. Since the household sector is the largest sector in the economy, it is no wonder the Index receives a lot of attention as large swings in consumer confidence are often followed by large swings in real activity.