

Since it announced a crackdown on outstanding debt in June last year, Centrelink has sent debt recovery letters to thousands of Australian welfare recipients. Early reports indicated that around 20% were issued in error, although the true number may be substantially higher.
This led to the appointment last week of a Senate committee to investigate why so many erroneous letters were sent.
While there has been some controversy over the government’s reliance on big data to save taxpayers’ money, none of the commentary has come close to understanding the complexities hidden in the notion of the error rate.
The system that Centrelink employs is an example of artificial intelligence, and the problems it faces are intrinsic to all decision systems.
Working with error
Mathematicians, computer scientists and engineers have long grappled with these problems and developed ways of quantifying the errors, as well as determining the point that balances their relative importance.
The same mathematics is used to describe radar systems, disease screening programs, and speech recognition systems such as Siri and Google Cloud Speech.
But is it an error in itself to talk of a single error rate for such systems. That assumes there is only one way to make an error, or that all of the different types of errors are equally bad, which is almost never the case.
For example, there are at least two ways the Centrelink system can make a mistake in its job of sending letters to debtors. It can send a letter to someone without a debt or it can overlook sending a letter to someone who does have a debt.
The former error is a false positive, and the rate at which a system avoids this type of error is called the sensitivity. The latter error is a false negative, and the associated rate is called the specificity.

Radar systems, which use radio waves to detect aircraft, are where this notion of multiple sources of error was first formalised. It is important not to miss a detection of aircraft (false negative) but the avoidance of mistaken detections is equally important.
Having to constantly deal with incorrect reports is fatiguing for the operator and may cause them to discount valid detections – like a modern version of The Boy Who Cried Wolf.
Screening errors
Another example of the importance of multiple error mechanisms is in breast cancer screening programs.
While it is good to catch cancers early, it is also important to correctly clear women without breast cancer due to the psychological harm caused by the stress of an incorrect diagnosis.
These systems use a type of machine learning called classification. A classification system uses all of the available data to decide into which class a particular case falls. We have already seen that for a two-class problem (Centrelink: letter or no letter) there are two ways to make an error.
But it gets worse: for a three-class problem (a cancer test that decides between clear, benign and malignant) that number rises to six. The more decisions a system makes, the more ways it can fail.
Nobody’s perfect
It is not possible to make a perfect system. Errors in data entry, natural variability and human error all play their part in blurring the line between debt and no debt, malignant or benign, detection or false alarm.
The following sequence shows how a mathematician approaches the decision process using a simplified model of the Centrelink system, where we cross-reference someone’s declared income against their actual income. The following sequence uses simulated data that assumes only that debtors’ actual income is higher than their declared income.

But the intrinsic uncertainty in the data, and the freedom we have to choose the decision line, shows the impossibility of simply defining the error rate.
What we can do is summarise the performance of the system using a method known as receiver operating characteristic (ROC) where we move the decision line and record the true and false positive rates for each position.
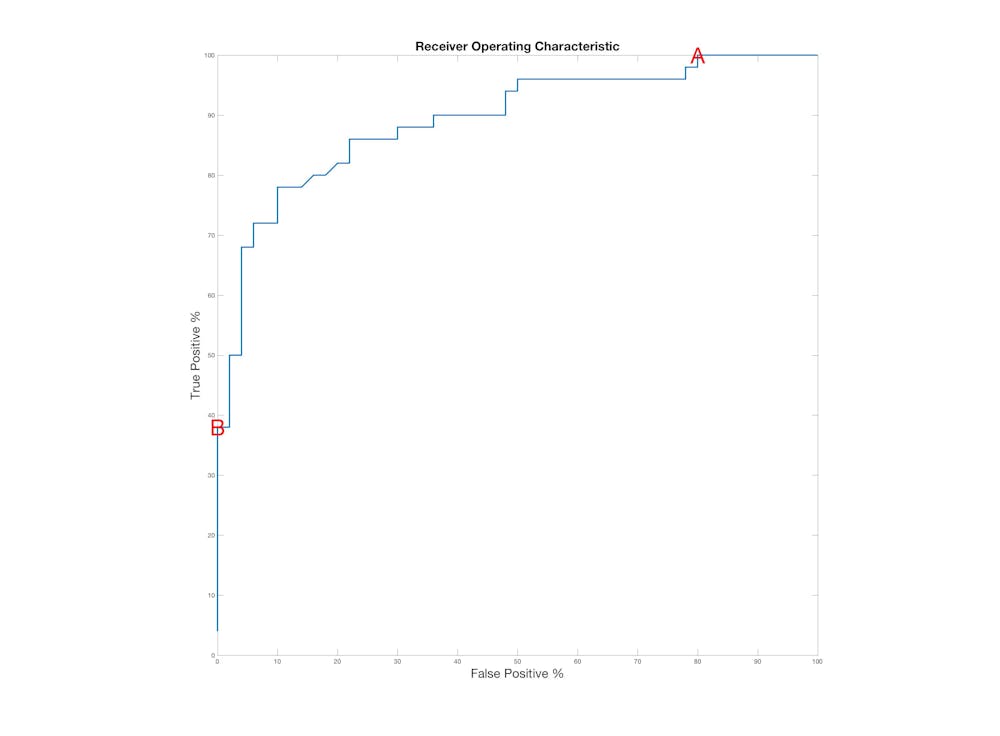
The true positive rate is the percentage of debtors sent a letter, and the false positive rate is the percentage of people incorrectly sent a debt letter. This graph is generated by marking all true positive/false positive pairs for each possible decision line against the same simulated data used earlier.
There are two things we can see from this graph: if you want to identify all of the debtors (100% true positive) you will also catch 90% of the debt-free in your net. This point is marked A on the curve. Furthermore, if you do not want to write any unnecessary letters (0% false positive) then you will only find 38% of those who should pay back a debt (marked B).
As usual, a trade off is unavoidable, and the sensible way lies somewhere in between. That’s why you have to accept that there will always be some errors in your system. The challenge is how to balance them, and how to deal with them whey they are occur.
Why now?
One puzzle remains for the Centrelink system. The data matching algorithm has been in use for several years in a manual form, but only now is it making headlines.
The answer lies in the expansion of its application. The automated system sends out 20,000 letters a week, a 50-fold increase on the the manual system. Broadening the population to which a system is applied has diminished its effectiveness.
Imagine we have a test for breast cancer that is 99% accurate at identifying cancer, and clears those without cancer 99% of the time. This sounds like a great test, but when we use it for mass screening, such as applying it to every Australian, things will go wrong.
The prevalence of breast cancer in Australia is 61 per 100,000 people. This means the test will correctly identify all but 14 of the approximately 1,400 new cases in the country each year.
But by the same token, 230,000 people will be incorrectly diagnosed with cancer and recalled unnecessarily for further expensive and invasive testing to clear them completely. That’s not to mention the stress and worry these incorrect diagnoses would cause. It would rightly be denounced as a disaster.
The actual screening program avoids this trap by narrowing its application to women over 50, which is a small enough population for whom the prevalence is high enough to make screening useful.
Lessons to learn
The Human Services Minister, Alan Tudge, says that sending a letter to a non-debtor is not an error.
But, as we have seen, downplaying these errors and concentrating only on identifying more and more debtors magnifies the number of this second type of error.
Also, expanding the data-matching system and removing the human element from the case-selection process has undermined the system’s performance even further.
By underestimating both the number of errors possible and the effects of their interaction, Centrelink is left dusting itself off after having been hit by a big steaming pile of data.