


With almost a third of votes cast already in postal and pre-poll voting for the Voice to Parliament referendum, the “yes” campaign is ramping up its advertising and media efforts. Both campaigns are in the home straight ahead of Saturday’s crucial ballot.
Recent polls indicate that in the closing weeks of the campaign, support for the “no” campaign has slowed somewhat, but “yes” still sits at around 42% nationally.
This week, Professor Simon Jackman’s average of public polling placed “yes” at 42.7% nationally, with a 1.7-point margin of error. The best recent polls for “yes” continue to be those fielded by Roy Morgan and Essential, with support in the mid-40s. Newspoll (now administered by Pyxis) and Redbridge, meanwhile, have “yes” support in the high-30s.
What’s happening in online advertising?
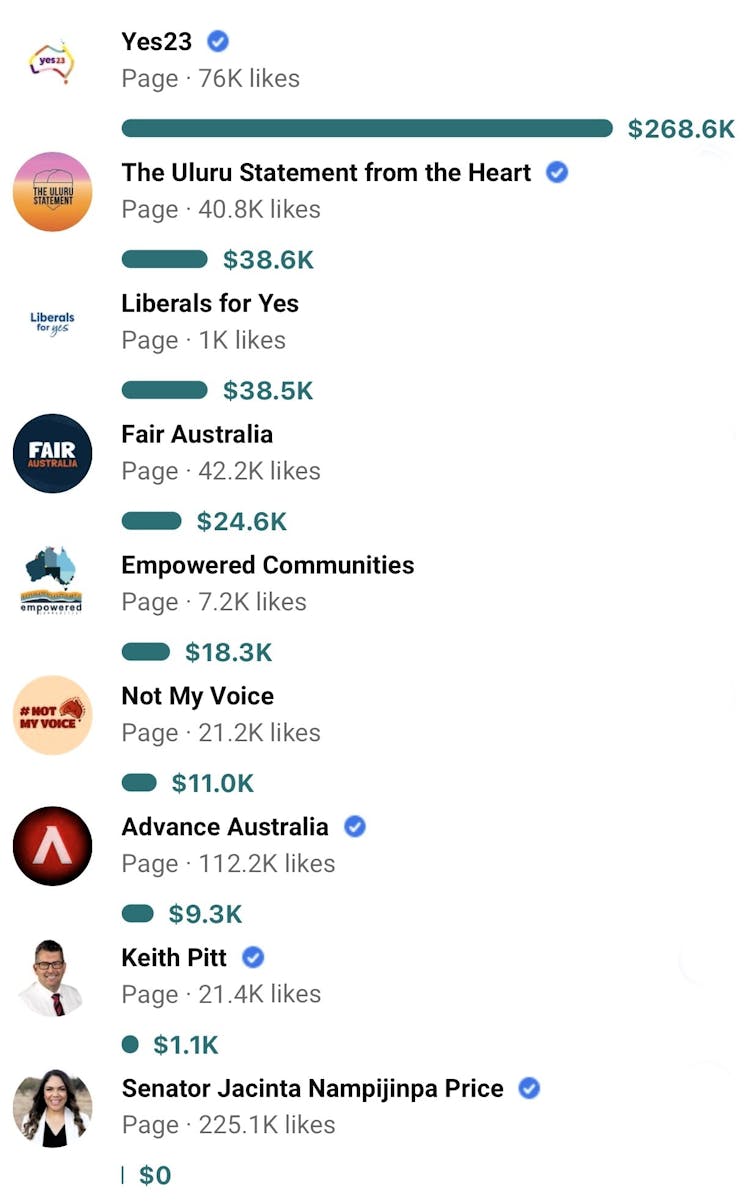
Consistent with what we have seen during the course of the campaign, the Yes23 campaign has outpaced other paid referendum campaign groups in its online advertising spending on Meta platforms (Facebook and Instagram), the most-used platforms for online advertising during this campaign.
Four of the top five online advertisers are supporting the “yes” campaign, with A$364,000 in total advertising spending this past week. Yes23’s ad spend is distributed fairly evenly (relative to population) across the mainland states, reflecting its goal to attract national support.
The top “no” campaign advertisers on Meta spent just $46,000 this past week. This includes Fair Australia, supported by Advance Australia; Warren Mundine’s separate “Not My Voice” campaign, and Nationals MP Keith Pitt.
Read more: The 'no' campaign is dominating the messaging on the Voice referendum on TikTok – here's why
In comparison to Yes23’s blanket coverage, Fair Australia is chiefly targeting South Australia and to a lesser degree Tasmania. Assuming it will win sympathetic states like Western Australia and Queensland, the “no” campaign only needs to win one more state (either South Australia or Tasmania) to ensure the referendum fails.
Interestingly, Senator Jacinta Nampijinpa Price is no longer spending on social media advertising. Perhaps this is because she already has a sizeable presence on Meta (with a quarter million followers) and is generating millions of likes for her “no” campaign videos on the free platform, TikTok.
What’s happening in the news and social media?
During the past week, which aligns with the commencement of pre-polling, our analysis of free media coverage – print, radio, TV and social media – shows that Voice coverage has unsurprisingly increased in volume since our last data report two weeks ago.
The Voice referendum made up 7.3% of total coverage during the week, up from 6.7% reported in our previous analysis.
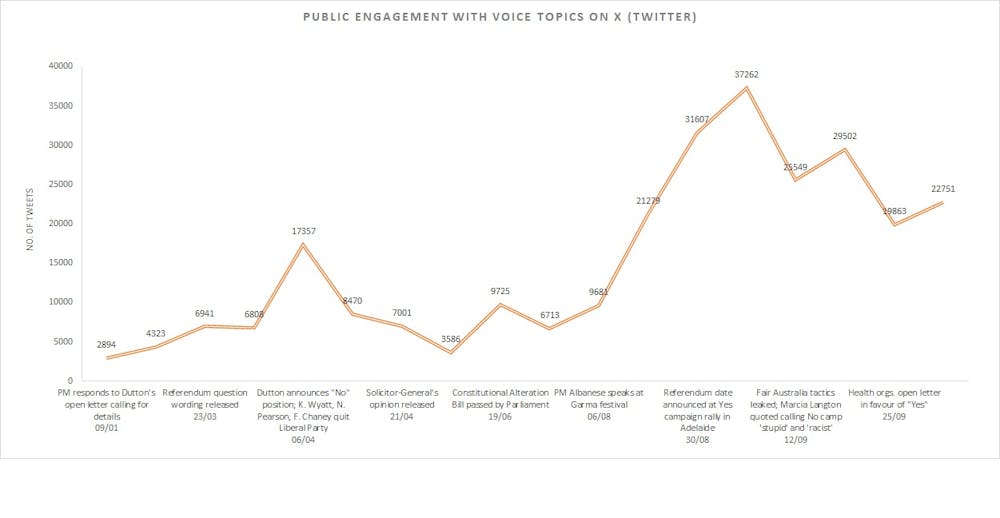
Recent stories getting the most attention on X (formerly Twitter) were:
an open letter from more than 100 health organisations advocating in favour of “yes”
widespread discussion of the uncivil nature of the referendum debate
the start of early voting
and Garigarra Riley-Mundine, the daughter of leading “no” campaigner Warren Mundine, publicly supporting the Voice.
How we further analysed media content
But what can we see about the distinctiveness of the campaign coverage since the referendum was announced on August 30?
One way to answer that is to look at the supply side of the debates. Supply represents what (and how much) information is in the public domain – as opposed to the demand side, which reflects how Australians engage with or react to the coverage.
To better understand this, we analysed about half a million Twitter posts and mainstream news stories from Meltwater, a global media monitoring company, combined with 50,000 Facebook and Instagram (public) posts that have appeared since the announcement of the referendum date.
We then used an algorithm to categorise this content into one of five distinctly relevant narratives. Put simply, think of a machine that can organise a collection of many different LEGO blocks (or in our case, media items) into a predetermined number of bins (in our case, topics), based on the LEGO blocks’ similarities (in our case, the key words that make up these narratives).
The algorithm gives us a quick – and rough – estimate of what’s being said in the public sphere across our screens, airwaves and newspapers during the campaign.
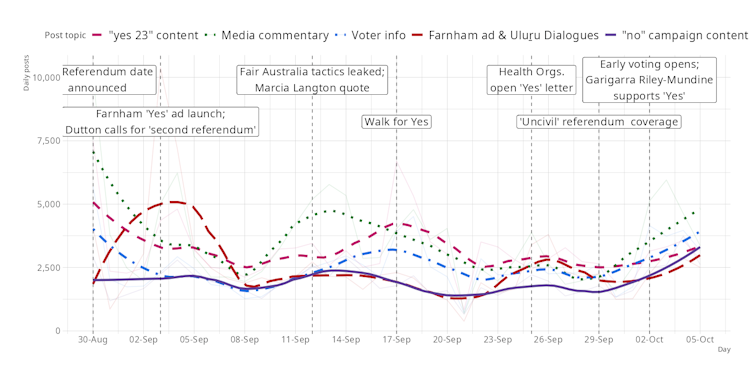
As seen below, about a quarter of the data we analysed – the largest distinct category – comes from general media commentary, constituting a complex mix of positive and negative coverage reflecting Australia’s increasingly polarised media landscape.
We estimate language supporting the two main “yes” campaigns comprised over 40% of the public debate, providing mostly affirmative messages about the referendum.
The algorithm categorised the “no” camp’s distinctly negative language at well under 20% of the overall debate. This included coverage from Sky News, which has been much more negative about the Voice.
General voter information coming from a range of sources, including the Australian Electoral Commission and the Australian government, made up another about 18% of the total media and social media content during the campaign.
All this data tells us a little about what’s been said during the campaign and the evolving nature of the debate as various narratives gain and lose popularity.
So, if the “yes” side has been contributing the lion’s share of Voice content over the past six weeks, why are the polls not closer?
That’s a complicated question because not all media and messaging are equal. Nor do we know how well campaigning actually changes voter behaviour.
We are also just looking at the supply side of free media only, not paid advertising or private messaging spaces. And we know the “no” side has had millions of people engaging with and sharing its content, which is not tracked here.
Rough estimates like these efforts, though, suggest there’s much more to be learned – both about our nation and, crucially, about ourselves.