
These days, social media and online apps have become a major source of disaster information and warnings. But how much can we trust them?
Today, more than 82% of Australians use the internet and 76% can access it on a smartphone or other mobile device. These numbers have been rising rapidly – the rate of mobile access more than doubled from 2010 to 2013.
In recent years, many have turned to official online sources for fire information and weather warnings. And joining official authorities’ bushfire crisis maps is Google’s Fire Crisis Map and Public Alerts.
Google’s map shows fire locations together with their severity and activity (such as if they are ongoing). It also pinpoints areas at risk, registered back-burning, traffic and road conditions and links to further information. It uses state-level fire authorities as its source.
The alerts system gathers and summarises information published on the internet. It generates localised crisis alerts, shows them on the Google maps app, and sounds an alert to people with an Android smartphone in a crisis area.
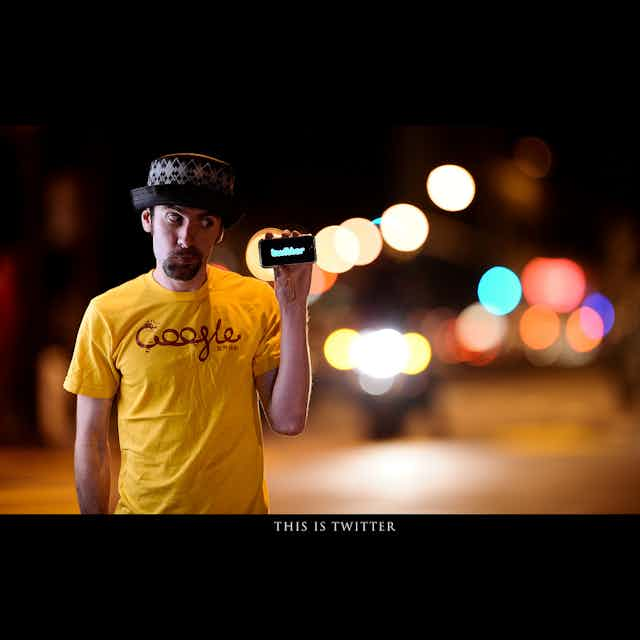
Tweet alert!
In June 2011, more than 300 million registered users (150 million active users) on Twitter sent 200 million messages per day. That’s ten million page-equivalents of tweets that would take over 31 years to read. In June 2010, 65 million tweets were sent and in January 2009, two million.
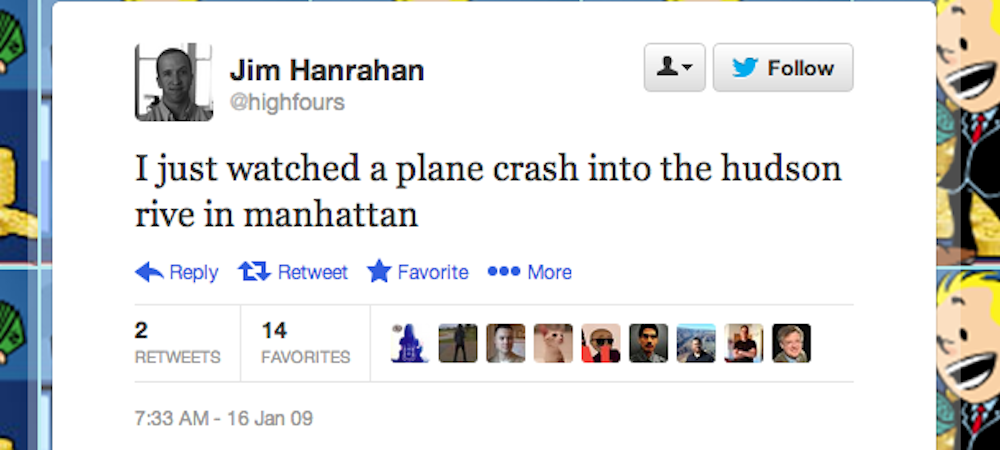
The role of Twitter changed from a personal real-time messaging network to a global crisis informatics solution in January 2009. A tweet broke the news about a plane crash in New York 15 minutes before the media.
Ever since, Twitter gained more and more importance in crises. During the Queensland floods from January to March 2011, people posted approximately 1,100 floods-related tweets per hour.
In October 2008, when wildfires destroyed 500,000 acres of land and 1,500 homes in California, 76% of affected people sought, and 36% provided, information on Twitter or similar online solutions.
In February 2010 more than 4.5 million messages described or verified information related to a Chilean earthquake, which killed 723 people and damaged 370,000 homes.
The top topics in Twitter in the first half of 2011 included
- AH1N1
- the Japanese earthquake and tsunami
- the Fukushima and Chernobyl nuclear disasters
- the Libyan civil war.
In August 2011, Twitter was used both to organise riots in London and clean them up in the UK.
Finding the warnings you need
Twitter messages hold the potential to be early indicators of crises. But to fulfil that potential they need intelligent search and summarisation systems to assure their accessibility and reliability.
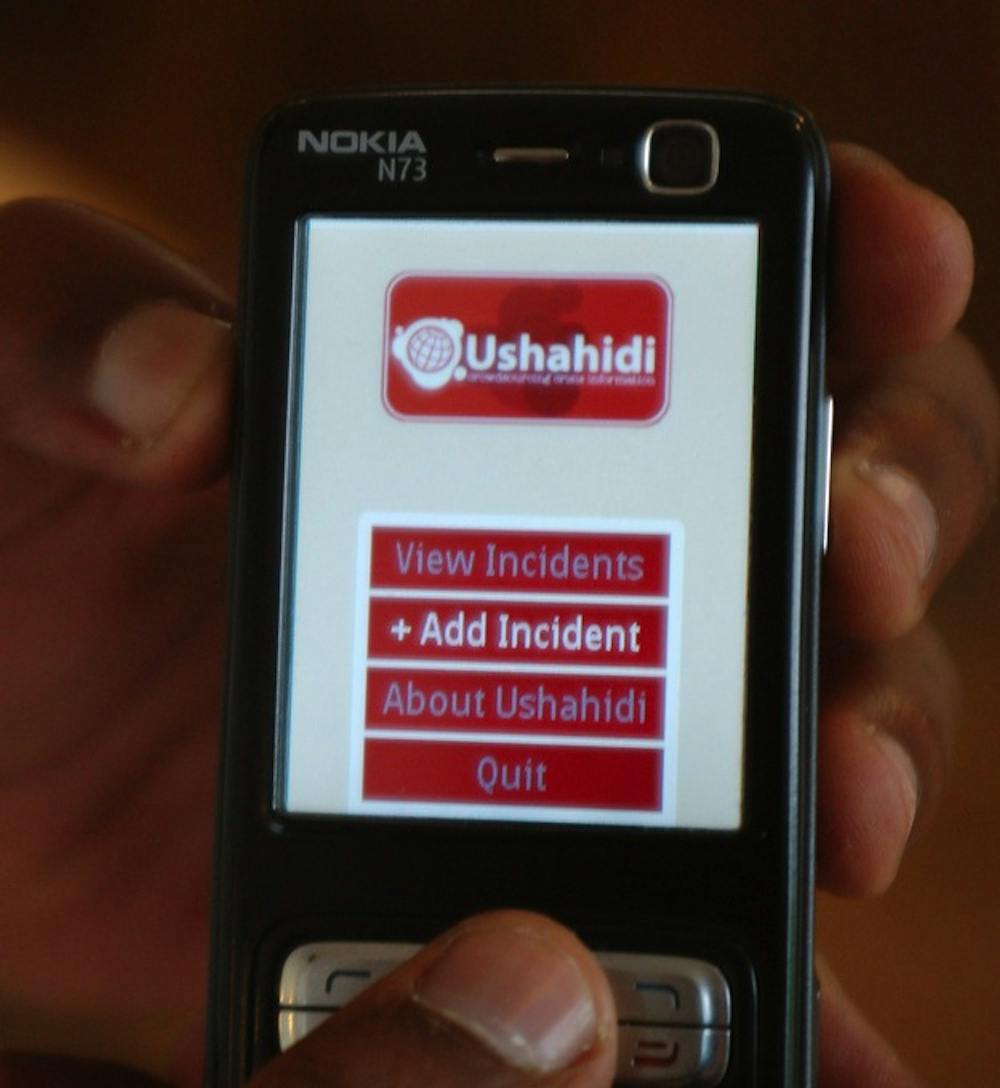
To illustrate systems of this kind, a map app called Ushahidi was developed in Kenya in 2008 for people to seek and provide information on incidents of violence and peace efforts related to the post-election fallout.
The incidents were reported online or via mobile phones. Around 45,000 people used the app to map incidents throughout the country and since then, it was extended to cover data gathering, visualisation and mapping more widely.
In January 2010, when an earthquake killed 230,000 people in Haiti, volunteers gathered an input for the Ushahidi app and authorities then used its output for direct assistance.
The input included not only tweets but also messages from mobile phones and Facebook, blogs and other social media. The output maps visualised in real time:
- trapped people
- medical emergencies
- shelter, water, food and other needs.
Anyone could access these maps online. For example, the United Nations used them to determine the what, when, where and how to allocate resources.
How can I help you?
At NICTA, we have developed two search and summarisation systems for Twitter.
Crisis managers, media and other people interested in summarising Twitter in real time can use NICTA Event Watch to monitor the message topics. The summary aggregates tweets into meaningful clusters as they emerge over time.
As I described in The Conversation in 2011, our classification system for crisis managers analyses tweets retrospectively which:
- identifies tweets that carry crisis information
- classifies them topically to seven threat categories by the United Nations: Food, Health, Politics, Economic, Personal, Community and Environment
- detects whether the author represents the official authorities, media, or laypeople.
Results serve educational purposes after a crisis. For example, the distribution of messages across the topic categories demonstrates the nature of the crisis. When applied periodically over time, analyses could reveal early indicators for specific developments during a crisis.
To follow the latest news on this system, see our paper to be published in December in Australasian Document Computing Symposium.