Tim Hortons’ iconic Roll up the Rim contest began in 1985 and went largely unaltered for 25 years. The format was simple: buy a coffee, roll up the rim of the paper cup and see if you’ve won a prize. But this all changed in 2020.
Amid the emergence of a global pandemic, the game went digital. Buying Tim Hortons products still earned you entries to the contest, but these were now stored on the company’s loyalty app. It was then up to you when to play these so-called “digital rolls.” Because players no longer roll up an actual coffee cup rim, the contest is now called Roll up to Win.
Last week I made national news as “the stats prof who cracked Roll up to Win”. I boosted my odds in Tim Hortons’ annual coffee contest to 80 per cent and then shared my strategy with the nation.
My approach sounds simple — play when other people aren’t — but it took data, determination and drinking a lot of coffee to find the optimal approach.
Here’s the story of the statistics behind the headlines.
Digital element changes odds
As I explained in 2020, “digital rolls” introduced an element of strategy to the game. There’s one major trick to increasing your odds: play when other people aren’t.
So when are the fewest people playing?
On the surface this seems simple: play in the middle of the night when most Canadians are asleep. But in a country spanning six time zones, finding the single best time is a challenging calculation.
In previous contests I made an educated guess that 4:30 a.m. Eastern was the sweet spot: not too late and not too early. But an educated guess is still a guess, and if I wanted to find the true Goldilocks zone of free coffee I’d need data.
This year, that’s exactly what Tim Hortons gave me.

Getting data from the app
Logging in to the app on the first day of the contest on March 6, a large message grabbed my attention: “More than 308,619 prizes already awarded!” This is an enticement to play — so many winners already! — but it’s also a valuable piece of information.
I waited five minutes and refreshed the page. The message changed: “More than 309,949 prizes already awarded!” Another 1,330 prizes had been won.
This gave me an idea.
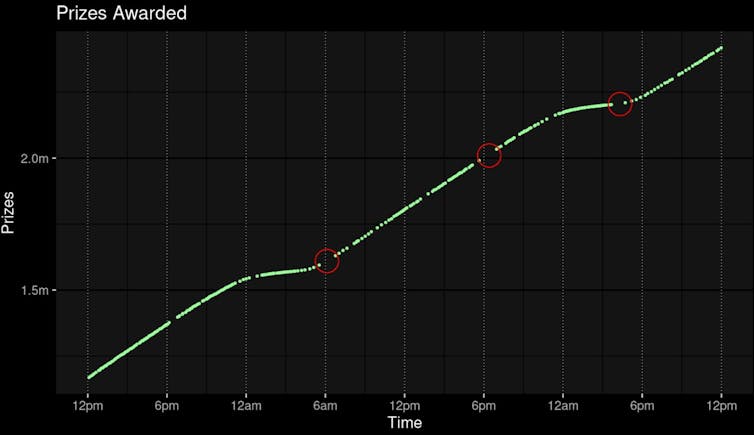
I periodically refreshed the page, logging the time and number of prizes awarded. My theory: the number of prizes won should correlate with the number of people playing. By tracking these data I could build a model of Roll up to Win player behaviour and, by extension, calculate exactly when I should play.
Tracking online data is common in scientific research and often employs software to download information automatically. Automated procedures are usually against the rules of contests like this, however, and Roll up to Win was no exception. So I gathered the data manually.
Refreshing the page myself throughout the day — and night — I was able to approximately track the prizes. But I did have other things to do, so there were gaps in my logs. In statistical terms, I had what’s known as missing data.

Missing data are common in real-world analysis. Examples include unreturned or incomplete surveys, patients missing medical appointments or even misplaced or corrupted data files.
Statistical challenges
This can present statistical challenges depending on how — and why — we have gaps in our records. A patient might miss their appointment because they were too unwell to travel, or maybe just because their car wouldn’t start. These two scenarios provide different information, requiring different solutions.
My missing data problem was comparatively simple. My goal was to fill in the gaps that arose when I was sleeping, travelling or otherwise away from my keyboard.
Using the data I did have, I looked for patterns. The most prizes were being won between 9 a.m. and 1 p.m. Eastern, the fewest around 3 a.m. This repeated each day and I was able to use this to my advantage.
To map our mathematical models onto the real world, statisticians often make assumptions. I assumed that player behaviour patterns would be similar day-to-day. This was a fairly strong assumption — I had some evidence of a slightly later start on Sunday mornings — but it seemed a reasonable one for my problem.
Weighting the data
I could then combine each day’s data and employ a technique known as weighting. Days where I had logged more observations were given more importance — or weight — in my calculations. I was then able to use statistical methods to “join the dots” and map out the overall shape of player behaviour.

With this, my educated guess of previous years became a data-driven estimate. The best time to play was 3:16 a.m. Eastern — over an hour earlier than I was playing in the past — and the worst was 11:46 a.m. There is always some statistical uncertainty in an analysis, but playing around these times should give you the highest and lowest chances of winning.
There was one last step: I had to test my results. My analysis was predicated on another assumption: that the number of available prizes was consistent through the day. Maybe fewer people were winning at 3 a.m. because there were fewer prizes, not fewer players. Luckily, this was an assumption I could test.
3:16 a.m. is the golden hour
I racked up 60 rolls and split them in half, playing 30 around the 3:16 a.m. mark and the rest just before lunchtime. I won 23 times in the early hours compared to just five times later on. No big prizes — mostly a lot of free coffee — but I got the result I was hoping for: statistically strong evidence that my theory was correct.
I reached out to a local journalist who’d worked with me in the past. I thought this might be a fun little story about applying statistics to the real world, with a hint of local colour as a University of Waterloo professor. Then things snowballed. By the end of the week I’d appeared on countless radio stations and even nationally broadcast television shows including CTV’s Your Morning and CBC’s The National.
While the interviews were a great opportunity to showcase how stats can be more than just equations in a textbook, many outlets spotted a potential flaw. If everyone starts playing at 3:16 a.m., won’t the strategy change?
The short answer is yes, and it illustrates a concept from another area of study: game theory. Sometimes when everyone knows the best strategy it can turn into the worst strategy.
That said, I don’t think everyone will be getting up in the middle of the night to win a free coffee, so it should remain a good time to play.
I’ll be up in the early hours tracking the data for the last week of the contest — all entries must be played by April 9 — to see if the strategy needs updating. It’s a few more late nights, but I think I have enough caffeine for that.

