

The North American Great Lakes contain about one-fifth of the world’s surface fresh water. In May, new high water level records were set on Lakes Erie and Superior, and there has been widespread flooding across Lake Ontario for the second time in three years. These events coincide with persistent precipitation and severe flooding across much of central North America.
As recently as 2013, water levels on most of the Great Lakes were very low. At that time some experts proposed that climate change, along with other human actions such as channel dredging and water diversions, would cause water levels to continue to decline. This scenario spurred serious concern. Over 30 million people live within the Great Lakes basin, and many depend directly on the lakes for drinking water, industrial use, commercial shipping and recreation.
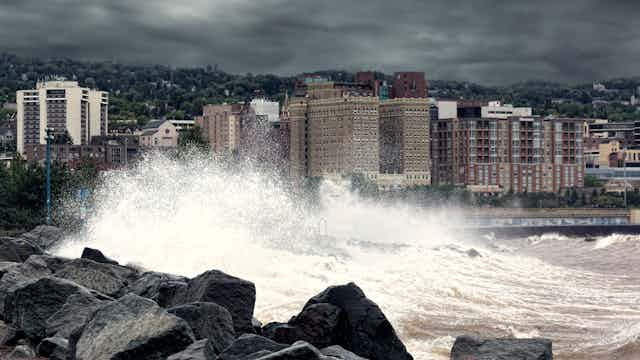
But since 2014 the issue has been too much water, not too little. High water poses just as many challenges for the region, including shoreline erosion, property damage, displacement of families and delays in planting spring crops. New York Gov. Andrew Cuomo recently declared a state of emergency in response to the flooding around Lake Ontario while calling for better planning decisions in light of climate change.
As researchers specializing in hydrology and climate science, we believe rapid transitions between extreme high and low water levels in the Great Lakes represent the “new normal.” Our view is based on interactions between global climate variability and the components of the regional hydrological cycle. Increasing precipitation, the threat of recurring periods of high evaporation, and a combination of both routine and unusual climate events – such as extreme cold air outbursts – are putting the region in uncharted territory.
Calculating the lakes’ water budget
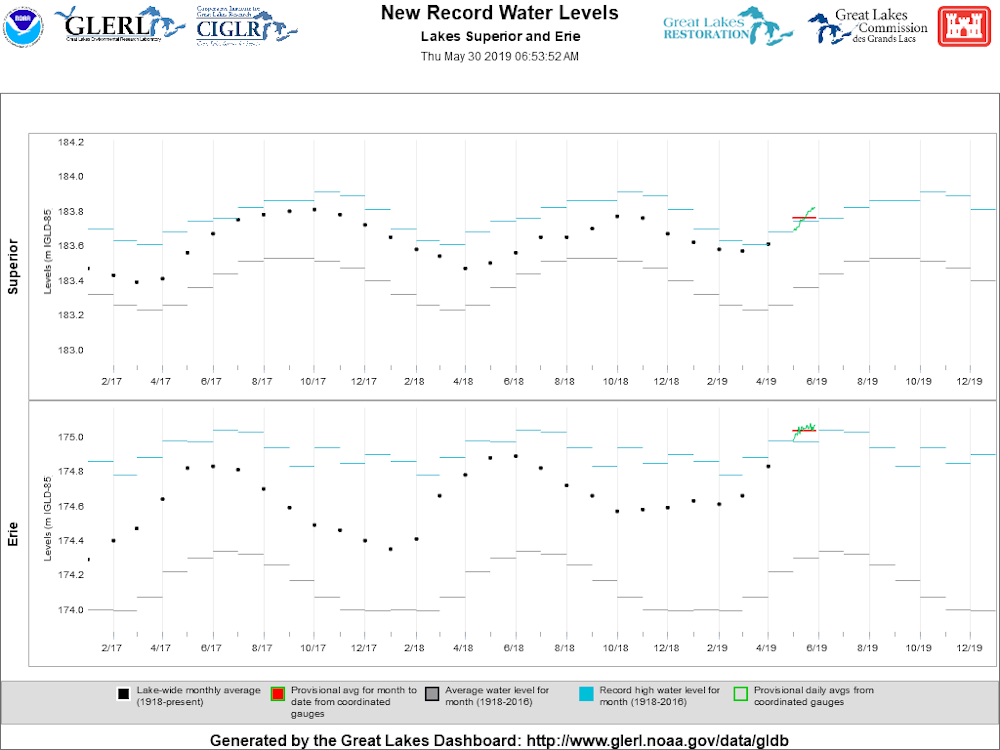
Current water levels on the Great Lakes are setting records. Lake Superior, the largest freshwater lake on Earth by surface area, surpassed its record of 602.82 feet for the month of May, and is poised to set a new record for the month of June. Lake Erie, the world’s ninth largest lake by surface area, surpassed not only its record water level for the month of May, but also its all-time monthly water level record of 574.28 feet, which has stood since June 1986.
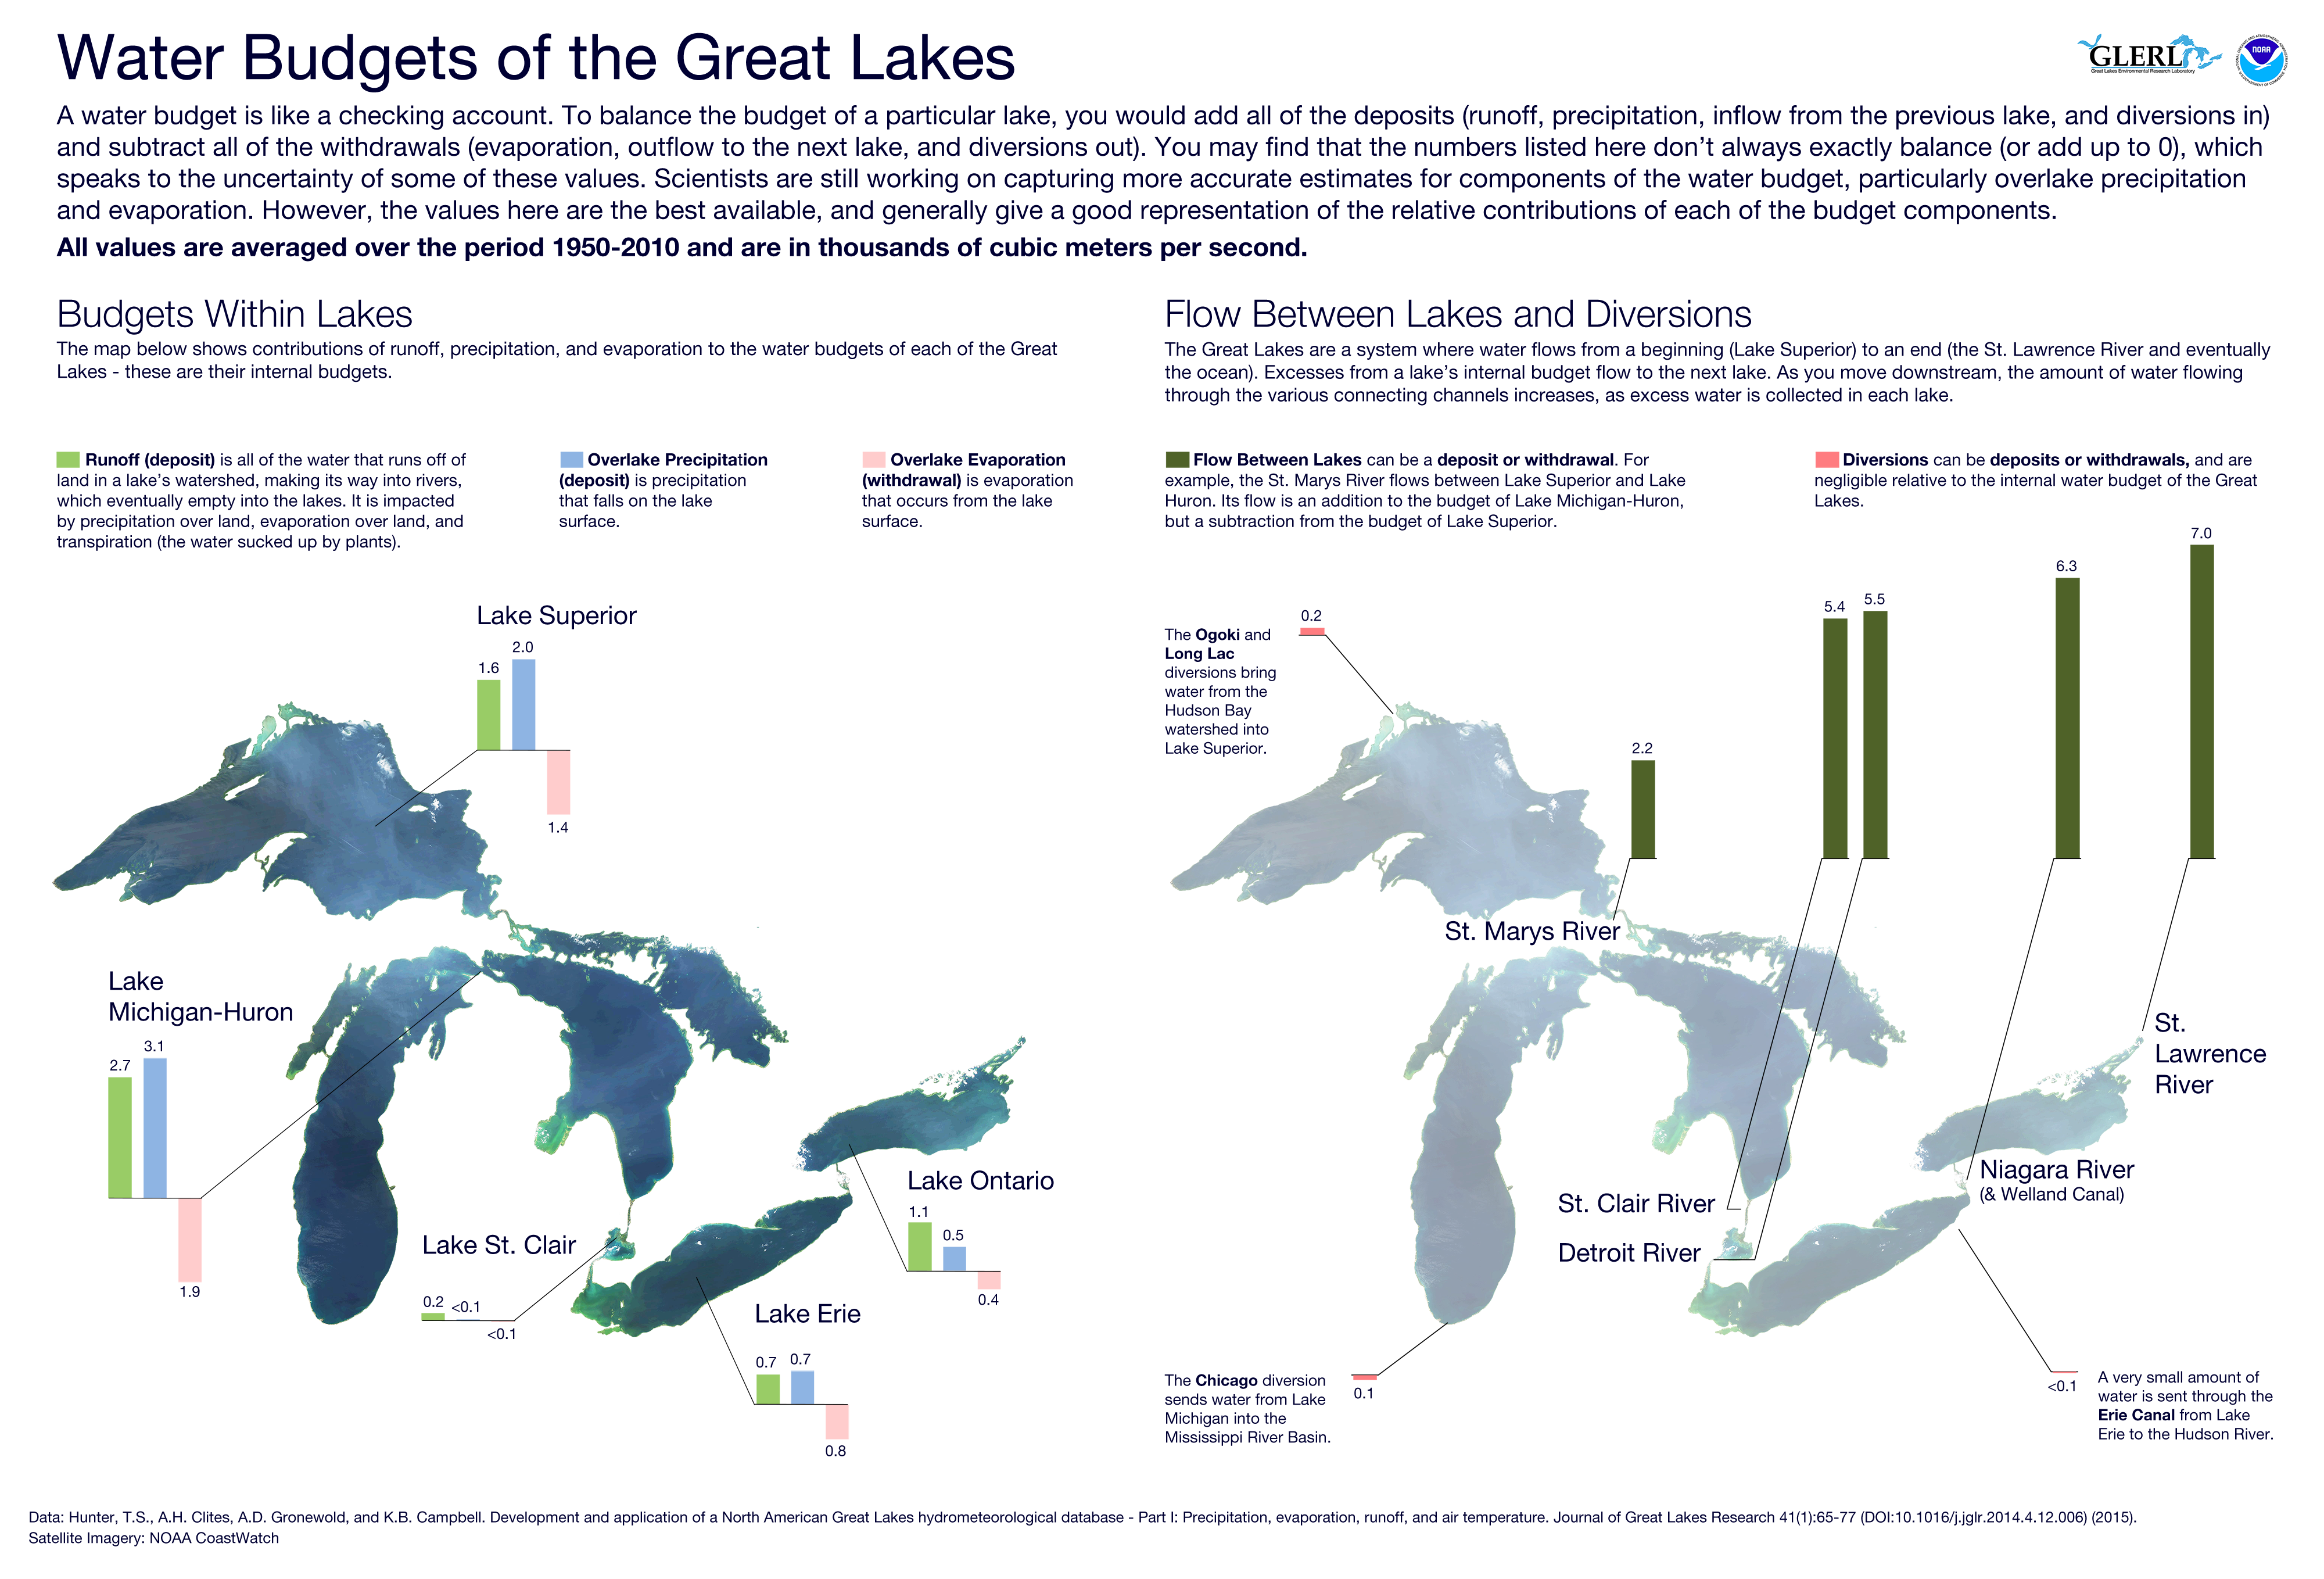
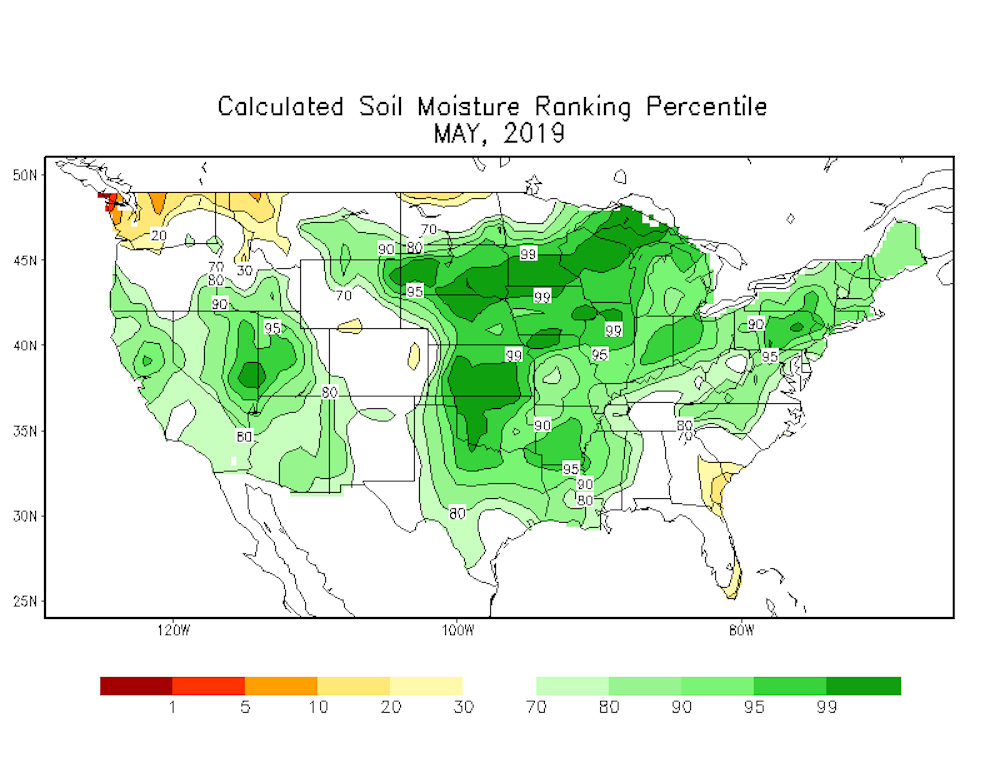
These extremes result from changes in the Great Lakes’ water budget – the movement of water into and out of the lakes. Water levels across the lakes fluctuate over time, influenced mainly by three factors: rain and snowfall over the lakes, evaporation over the lakes, and runoff that enters each lake from the surrounding land through tributaries and rivers. Runoff is directly affected by precipitation over land, snow cover and soil moisture.
Interactions between these factors drive changes in the amount of water stored in each of the Great Lakes. For example, in the late 1990s surface water temperatures on Lakes Superior and Michigan-Huron rose by roughly 2 degrees C. Water evaporates more rapidly when it is warmer, and during this period evaporation rates were nearly 30% above annual average levels. Water levels on Lake Michigan-Huron dropped to the lowest levels ever recorded.
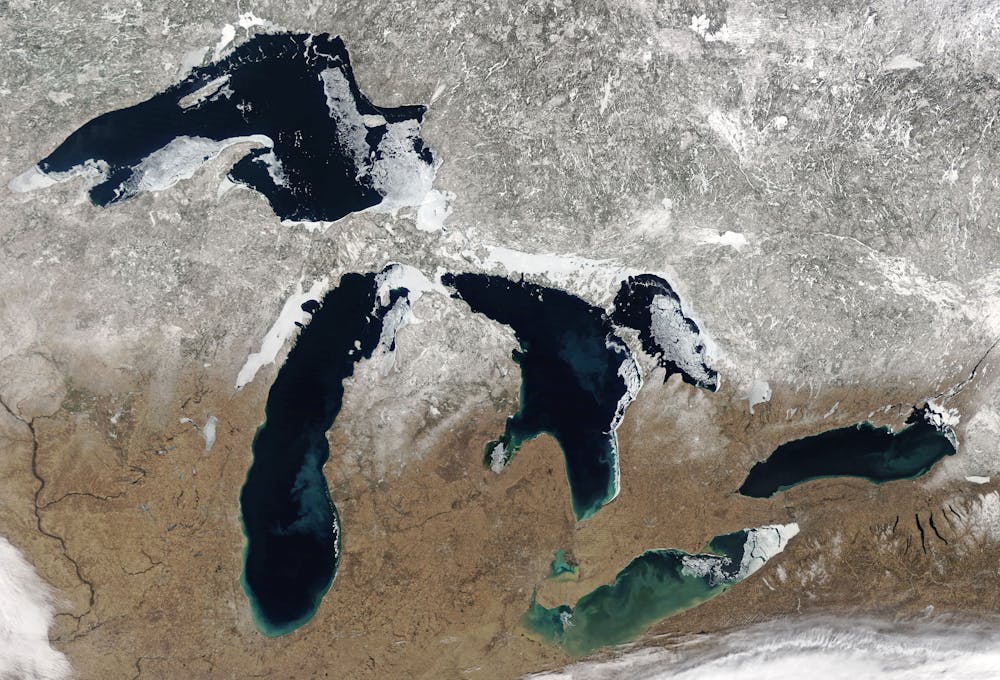
Then in 2014 the Midwest experienced an extraordinary cold air outbreak, widely dubbed the “polar vortex.” The lakes froze and evaporation rates dropped. As a result, water levels surged.
At roughly the same time, precipitation was increasing. The 2017 Lake Ontario flood followed a spring of extreme overland precipitation in the Lake Ontario and Saint Lawrence River basins. The 2019 flood follows the wettest U.S. winter in history.
What do these trends mean for water levels? In addition to the current onset of record highs, water levels in Lake Erie have been rising earlier in spring and declining earlier in fall. More winter precipitation is falling, often as snow. The snow is melting earlier in response to rising temperatures and shorter winters. The resulting runoff is then amplified in years like 2019 with large springtime rains. The net effect of this combination of hydrological events is that Lake Erie’s current water levels are much higher than usual for this time of year.
The role of climate change
Great Lakes water levels have varied in the past, so how do we know whether climate change is a factor in the changes taking place now?
Precipitation increases in winter and spring are consistent with the fact that a warming atmosphere can transport more water vapor. Converting water from vapor to liquid and ice releases energy. As a result, increased atmospheric moisture contributes to more precipitation during extreme events. That is, when weather patterns are wet, they are very wet.
Changes in seasonal cycles of snowmelt and runoff align with the fact that spring is coming earlier in a changing climate. Climate models project that this trend will continue. Similarly, rising lake temperatures contribute to increased evaporation. When weather patterns are dry, this produces lower lake levels.
Wet and dry periods are influenced by storm tracks, which are related to global-scale processes such as El Niño. Similarly, cold air outbreaks are related to the Arctic Oscillation and associated shifts in the polar jet stream. These global patterns often have indirect effects on Great Lakes weather. It is uncertain how these relationships will change as the planet warms.
Tools for better forecasts
Rapid changes in weather and water supply conditions across the Great Lakes and upper Midwest are already challenging water management policy, engineering infrastructure and human behavior. We are undoubtedly observing the effects of a warming climate in the Great Lakes, but many questions remain to be answered.
The Great Lakes are, collectively, a critical water resource. Government agencies and weather forecasters need new tools to assess how future climate conditions may affect the Great Lakes water budget and water levels, along with better shorter-term forecasts that capture changing conditions.
Innovative techniques, such as incorporating information from snow and soil moisture maps into seasonal water supply forecasts, can help capture a full picture of what is happening to the water budget. The bigger point is that past conditions around the Great Lakes are not a reliable basis for decision-making that will carry into the future.