

This week, our experts examine the two most popular Q&A Twitter requests: can we trust Treasury, and how high is youth unemployment?
1. Peter Shergold: Treasury forecasts are too low in good times and too high in tougher times
“The fact is when the economy is going well… Treasury figures tended to underestimate how positive the economy was, tended to underestimate the revenues that are coming in. What we’re now seeing is the reverse: with economic volatility and downturn, they tend to consistently… be overestimating what the revenues are.” – Chancellor of University of Western Sydney, Peter Shergold, Q&A, 29 July (Watch the segment on Treasury forecasts here).
Shergold, who was the secretary of the Department of the Prime Minister and Cabinet until 2008 under the Howard and Rudd governments, was asked about shadow treasurer Joe Hockey’s recent declaration that the opposition could no longer trust Treasury’s economic advice.
Responding to news that the government is facing a forecast revenue shortfall of more than $20 billion over the next four years, Hockey told ABC Radio that the Coalition would seek outside economic advice rather than relying on Treasury’s pre-election update, as “our numbers will be more reliable than anything the government publishes because every single number the Labor Party publishes in government is dead set wrong”.
Hockey accused the government of “trying to bully the public service into a set of numbers that clearly do not properly represent the state of the budget”.
Shergold agreed that Treasury’s forecasts were often higher or lower than turned out to be accurate. However, he added: “I don’t think that’s anything to do with the politicisation of Treasury. Not at all.”
Instead, Shergold said he had found under the Howard government that Treasury’s forecasts tended to be too low in good times, and too high at times of economic volatility and downturn, as is the case now.
So is he right?
The answer can be found in a review of the Treasury’s forecasting done by a panel of independent experts late last year. The review looks at the accuracy of Treasury’s forecasts back to 1990, giving us a good run of data.
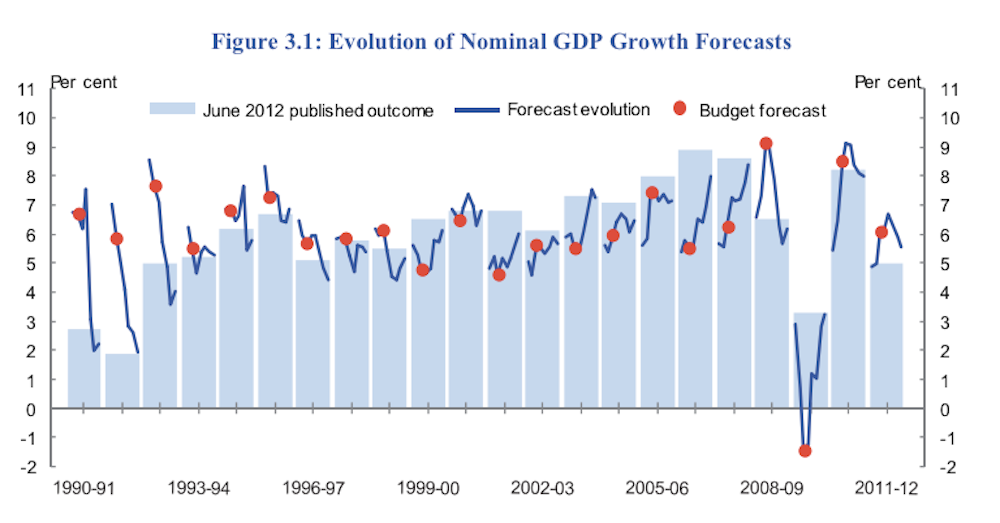
The review broadly confirms Shergold’s claim. For example, it shows that during the recession in the early 1990s, Treasury’s forecasts didn’t anticipate the downturn or the fall in tax revenue (see graph below).
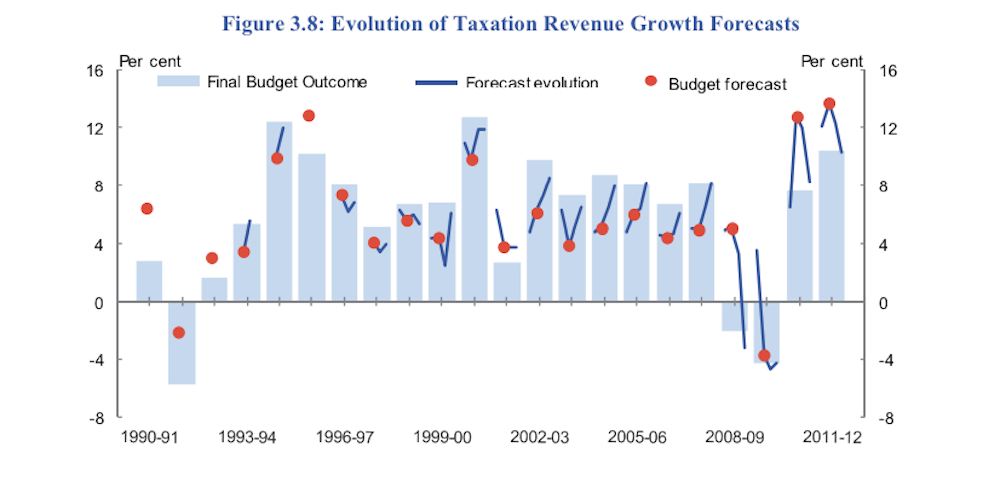
Afterwards, when the economy was growing pretty strongly, Treasury tended to underestimate how strong the growth in the terms of trade would be, how fast nominal gross domestic product (GDP) growth would be, and the consequent rise in tax revenue.
More recently, after the global financial crisis, Treasury got it wrong and has been overestimating tax revenues again.
However, this problem is not unique to Treasury. In fact, the same review showed that Treasury’s forecasts compare well to others, such as those from Access Economics and the Reserve Bank. They also were about as accurate as other international forecasters.
Consensus Economics – which compares about 20 or so Australian forecasting groups – also shows that Treasury forecasts tend to sit in the middle of the pack.
Forecasting is difficult and Treasury and others including private sector forecasters, tend to extrapolate based on what’s happened in the past. After all, when times have been good, you’re not likely to anticipate that’s going to end. And vice-versa.
Anyone can do a good forecast if you’re lucky and just looking at one year. But if you want to establish your credibility as a forecaster you need to look at a long track record of forecasts to see how good they are.
Verdict
Peter Shergold is correct. Treasury is more likely to underestimate figures during boom times, and overestimate when things take a turn for the worse. This is due to the nature of forecasting. - Graeme Wells
2. Josh Frydenberg: youth unemployment for 15-19 year olds is at a 15-year high
“For 15- to 19-year-olds who are out there looking for full-time work, we’re at a 15-year high – it’s more than 20%.” – Liberal MP for Kooyong, Josh Frydenberg, Q&A, 29 July. (Watch the segment on youth unenmployment and boot camps here).
The current full-time unemployment rate (that is, people looking for full-time work) for youth aged 15- to 19-years-old is 27.3%, according to the June 2013 ABS Labour Force Data.
That is the highest rate for 15 years, when it hit 29.7% in 1998. The lowest level of youth unemployment was in 2008 when it fell to 15.5%.
So Frydenberg is correct.
For most of the last 15 years, the 15- to 19-year-old full-time unemployment rate has hovered just over 20%. However, in just five years the youth unemployment rate has significantly increased.
But a lot of care needs to be taken in interpreting full-time youth unemployment rates. For a start, the total numbers are quite low. Currently there are 64,000 15- to 19-year-olds looking for full-time work, up from 49,500 in March 2008. So the increase in unemployment amounts to a total of 14,500 people.
While this should be of concern, changes in low numbers translate to large changes in percentage terms. Keep in mind the total size of the Australian labour force is 12,368,000 and the labour force for 15- to 19-year-olds is 810,400.
The overall unemployment rate for 15- to 19-year-olds, which includes those looking for both part-time and full-time work, has increased from a low of 12% early in 2008 to 16% in 2013. That’s an increase of 24,000, from 105,000 to 129,000 at present.
There are other concerns with the youth unemployment figures.
Not only has unemployment increased for 15- to 19-year-olds, there has been a decline in labour force participation for 15- to 19-year-olds over the past five years. From a high of 60% for most of 2008, it is now 54.6%. This means that there has been a withdrawal of young people from the labour market, either looking for work or in work.
It is often the case that if unemployment increases, people will withdraw from looking for work because of discouragement.
So how do we interpret what is going on in the youth labour market?
Of course, unemployment generally has been steadily increasing. At June 2013, the overall unemployment rate was 5.7%, up from 4.2% early in 2008. But this doesn’t sound so bad as the large increases in youth full-time unemployment.
So the forces that are affecting overall unemployment are showing up as particularly pernicious for young people. There is a growing concern about increased unemployment across the community and the effects on particular groups, including our youngest workers.
Verdict
Josh Frydenberg is correct. - Veronica Sheen