
Over the past two decades, scientists have developed ways to predict how ecosystems will react to changing environmental conditions. Called ecological forecasts, these emerging tools, if used effectively, can help reduce pollution to our waterways.
Dead zone and toxic algae forecasts are similar to weather and climate forecasts. They can provide near-term predictions of ecosystem responses to short-term drivers such as this year’s nitrogen and phosphorus inputs. They can also be used in scenarios to analyze the impacts of controlling those drivers in the future.
These particular forecasts are important because when they match actual events well, they build confidence in using the models to guide policy and management decisions. Doing these forecasts annually also provides a regular check on whether these problems are being resolved.
While knowing the extent and location of these ecosystem conditions could allow decision-makers to adapt their management decisions, current ecological forecasts – at least those related to dead zones and toxic algae – are not sufficiently tuned in space and time to support that scale of adaptive management. Hopefully, someday they will be. In the meantime, their use provides powerful reminders of unsolved problems.
This year’s eco-forecast
Dead zones (hypoxia) are regions within lakes and oceans where oxygen concentrations drop to levels dangerous to marine life. They’re typically caused by decomposing algae, the growth of which is stimulated by nitrogen and phosphorus inputs from land. Toxic algae, also stimulated by these same excess nutrients, can poison aquatic life and humans when they contaminate the water supply.
In recent weeks, I contributed predictions to NOAA’s ensemble forecasts of this year’s dead zones in the Gulf of Mexico and the Chesapeake Bay, and the extent of toxic algae in Lake Erie.
The 2015 forecasts remind us that these persistent problems are not yet being addressed effectively. While the dead zone forecasts are for roughly “average” conditions, it is important to note that “average” does not mean natural, and in these cases, “average” is not acceptable. The toxic algae forecast is a clear reminder that long-term nutrient input reduction is critical.
Gulf of Mexico - In its 2001 action plan – confirmed in 2008 and again in 2013 – the federal, state and tribal Mississippi River/Gulf of Mexico Watershed Nutrient Task Force set a goal of reducing the five-year running average extent of gulf hypoxia, or oxygen deficiency, to 5,000 square kilometers (1930 square miles) by 2015.
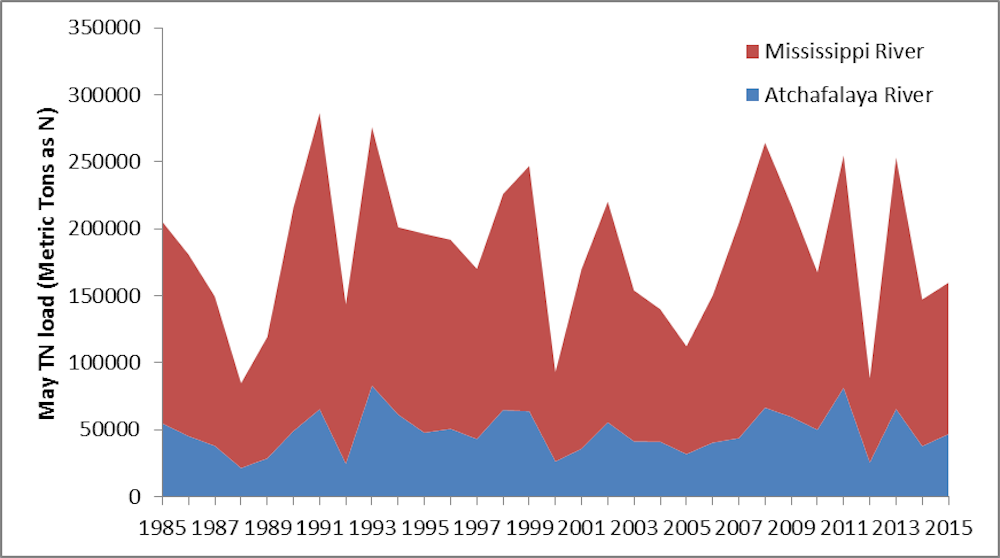
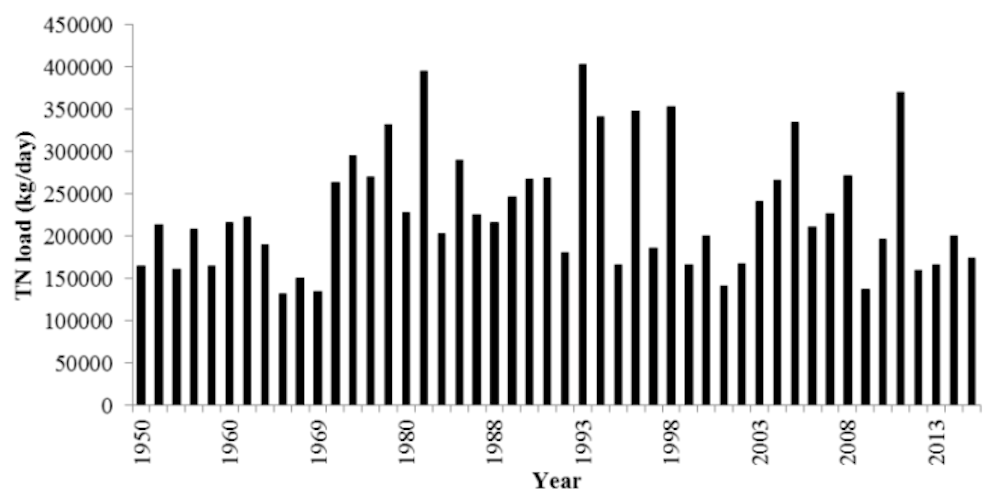
But little progress has been made toward that goal. Since 1995, the gulf dead zone has averaged 15,323 square kilometers, not unlike this year’s prediction of the size of Connecticut. Nutrient-rich runoff from Midwest agriculture ends up in the Mississippi River and eventually makes its way to the gulf. The amount of nitrogen entering the Gulf of Mexico increased, mainly due to agricultural runoff, by about 300% between the 1960s and 1980s, and has changed little since then.
While the size of the gulf dead zone varies from year to year, mostly in response to changing weather patterns in the Corn Belt, the bottom line is that we will never reach the action plan goal of 5,000 square kilometers until more serious actions are taken to reduce the loss of Midwest nitrogen and phosphorus from agricultural lands, regardless of the weather.
Chesapeake Bay - Similar to the Gulf of Mexico, the Chesapeake Bay dead zone forecast of 5.7 cubic kilometers (1.37 cubic miles or 2.3 million Olympic-size swimming pools) is slightly lower than its long-term average. Also similar to the gulf, there is very significant year-to-year variability in inputs and thus, hypoxia. But, unlike the gulf, there appears to be some progress being made toward nutrient input reductions.
Why? Under an Environmental Protection Agency- (EPA) enforced regional compact, six states and the District of Columbia have agreed to reduce the nitrogen load 25% by 2025. Notice the word “enforced.” Having in place a two-year milestone check in 2017 under the agreement’s Total Maximum Daily Load (TMDL) Watershed Implementation Plan should make a difference. Those metrics will be graded by the EPA, and if they are missed, warnings will be issued to members of the regional compact, and the consequences could include additional regulatory measures. The EPA recently determined that the region is likely to miss that goal by half. So, real accomplishments will depend on the resolve of the EPA and the administration in power to be tough in 2017.
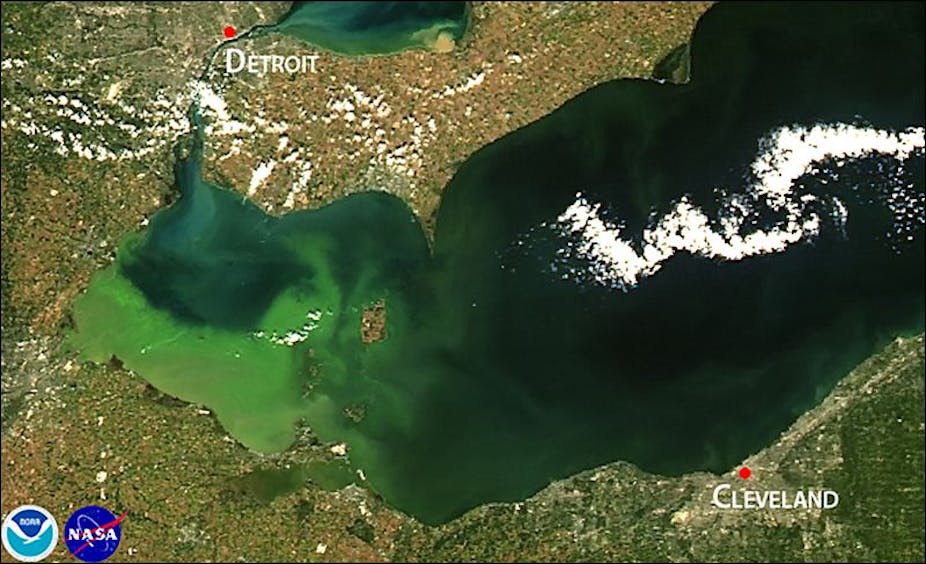
Lake Erie - This year’s Lake Erie toxic algae forecast is for a bloom larger than the one in 2014 that shut down the water supply to a half-million people in Toledo, and approaching the record-setting massive 2011 bloom. It’s worth noting that only a week or two before the formal forecast, NOAA was anticipating a relatively mild bloom, and the changed forecast was the result of one spring storm. Because these blooms are driven by diffuse phosphorus sources from the agriculturally dominated Maumee River watershed, this update is not surprising, and is a reminder of how much this issue is driven by these climate-induced increased storms.
In addition, unlike the dead zones, these blooms are highly dynamic in both time and space. In fact, while the 2014 bloom was much smaller than the massive 2011 bloom, it formed near Toledo’s water supply, and local winds mixed the bloom into the city’s deep-water intakes. So bloom predictions, regardless of size, do not necessarily correlate with risk. Until the phosphorus inputs are reduced significantly and consistently so that only the mildest blooms occur, the people, ecosystem and economy of this region are being threatened. We cannot cross our fingers and hope that seasonal fluctuations in weather will keep us safe.
Using ecological models for scenario analysis
We also participate in these annual forecasts because these same models are used to help guide decisions on long-term nutrient input targets needed to reduce dead zones and toxic blooms to acceptable levels.
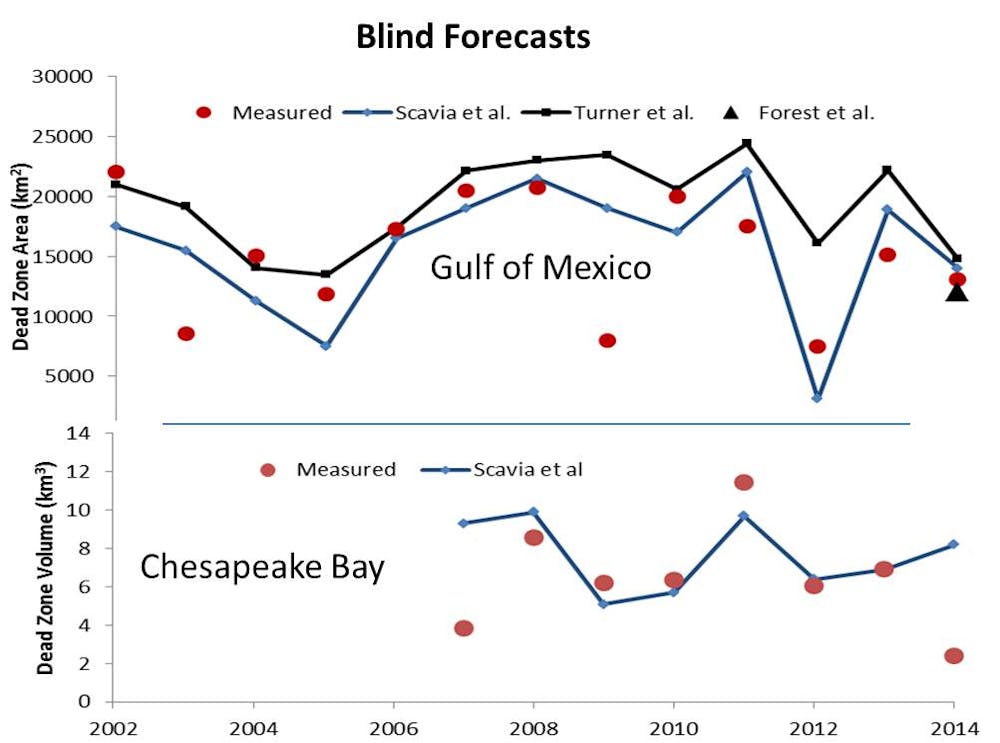
We have been tracking the accuracy of some of these annual forecasts and find the models do a pretty good job in years without hurricanes or tropical storms that disrupt dead zones prior to taking measurements. This increases confidence in using these models for providing advice on needed nutrient load reductions.
In fact, some of these models have been used to guide policymakers who set nutrient input reductions, and most reach the surprisingly consistent recommendations of reducing inputs by 35%-45%. However, while some of these recommendations have been in place for over a decade, little progress has been made. Forecasts, scenarios, recommendations and agreements are obviously not enough.
So what to do?
In a recent posting, I suggested that while more extensive application of existing and new agricultural best management practices (BMPs), such as streamside buffers and wetlands restoration, are important, they alone may not be sufficient in reducing nitrogen and phosphorus inputs to the Gulf of Mexico, the Chesapeake Bay, and Lake Erie. Even if BMPs were effective, the current voluntary, incentive-based regime is not working, as outlined in a report by Marc Ribaudo, senior economist for the USDA Economic Research Service.
The fact is, our watersheds are overwhelmed by industrial-scale row crop agriculture, much of it corn, and real progress will be made only by reducing the demand for corn. That requires modifying the American diet, urging changes in the agricultural supply chain and cutting the production of corn-based ethanol.
While changing diets and supply chains requires long-term cultural change, cutting use of corn in our cars could be done more quickly.
A simple although apparently politically dangerous move would be for Congress to prohibit the use of corn for ethanol production. This has been proposed many times in many places. So why does the federal government continue to insist on burning corn in our gas tanks – especially since it has been demonstrated that ethanol produces more greenhouse gases than gasoline and it is not good for either consumers or the environment? Perhaps the answer lies with presidential hopefuls running to Iowa every four years proclaiming love for corn and ethanol, and an ethanol industry building a stronger roster of lobbyists.
These are, of course, political considerations worked out in Washington, DC and state capitals. In the meantime, the dead zones and algae blooms we forecast every year show the ongoing damaging effects of excessive nutrient runoff.