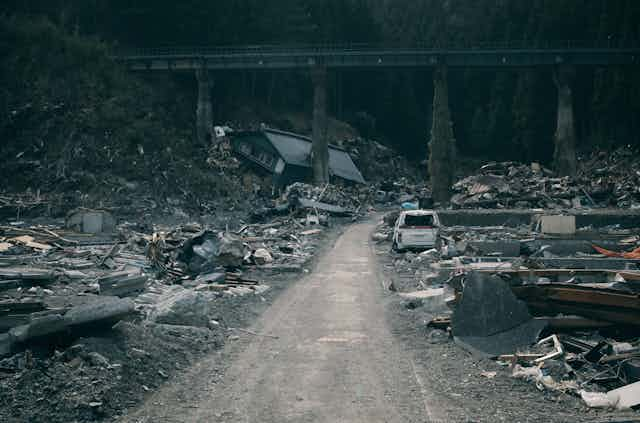

Ten years ago, on March 11 2011, a devastating earthquake occurred along part of a fault that scientists believe had not ruptured for more than a thousand years. The quake triggered a tsunami that caused more than 15,000 deaths in Japan, as well as a serious nuclear accident at a power plant in Fukushima.
It’s common for earthquakes to occur along faults that haven’t ruptured for hundreds or thousands of years. This is because rates of tectonic movement along individual faults vary from less than a millimetre up to several centimetres per year. During damaging earthquakes, a fault can slip a metre or more – more than 20 metres in the 2011 Japan earthquake – within seconds of the event starting. It could take hundreds or thousands of years to store enough stress on a fault before such an event occurs.
These long intervals between damaging earthquakes make assessing fault risks tricky, because much of the data informing our estimates of hazard is from historical records dating back hundreds of years at most.
But Earth holds the secrets to millions of years of earthquakes in its rocks. Studying them – and bringing the data together – we can develop a better idea of where the next big earthquake might happen.
We have only been using modern scientific instruments to measure and monitor earthquakes, and recording the data, for the last hundred years or so. Written records of earthquakes go back several hundred years.

But basing hazard calculations on the events that occurred in a relatively short time period – relative to the long-term average time between earthquakes on individual faults – may cause us to miss data from faults that have not ruptured. For example, in the central Apennines, Italy, the 2016 Amatrice earthquake that killed three hundred people occurred along a known fault that hadn’t hosted a historical earthquake.
Historical earthquakes give us clues about what types of earthquake can occur in certain spots. In the same region as the 2011 great east Japan earthquake and tsunami, the Sanriku earthquake occurred, in AD869.
Geological data
There is longer-term evidence, though, that can help. This comes through geologists analysing the physical structures of faults and looking at changes in the shape of the Earth’s surface caused by movements occurring over millions of years. Such data can be used to identify deformation that has occurred through multiple earthquakes over many millennia.
Techniques include tracing the same dated surface, sediment or structure that has been displaced across a fault and using this to measure how much movement has taken place over a time period either measured directly or inferred through relative timing of different geological events.
Read more: Fukushima: ten years on from the disaster, was Japan's response right?
We can also use sediments to identify past tsunamis. In Japan, researchers have found tsunami deposits buried under beaches and along shorelines showing the extent of where past tsunami have reached, giving us clues about their locations and size.
So why is such data traditionally not fully used in hazard and risk calculations? The problem is that such data can be difficult to collect and may not have sufficient detail to show which faults or parts of a fault have moved faster than others. Where it’s possible to obtain relevant and detailed data, it may not be easy for those who model hazards – trying to predict the likelihood of new events – to use.
Bringing the data together
I’m part of a group that aims to fix that accessibility gap, so that those calculating risk can integrate evidence across tens of thousands of years into their models. We’ve formed an international team bringing together those with expertise in collecting primary data on the ground and those with the modelling skills to calculate hazard and risk.
Our first endeavour has been to create a database which brings together our mapping of fault and rates of fault slip in an open-access format. We use this data to identify which faults pose the highest risk at particular sites.
For example, looking at the town of L'Aquila which suffered heavy damage in the 2009 earthquake, preliminary findings show that it’s not just the faults closest to the city that pose a threat. Significant risk comes from fast-moving faults further away like the fault that crosses the Fucino basin responsible for the 1915 earthquake that killed 33,000 people.

What can we do to help reduce earthquake risk? A first step is having good data about hazard and risk so that governments, civil protection authorities, insurers and residents can identify where to prioritise resources.
We can’t currently predict earthquakes – giving exact times and dates of when and where they will occur – and it’s not clear if we ever will be able to with precision.
But, we can provide probabilistic modelling identifying where events are more likely and the highest damage is expected. Incorporating long-term evidence can provide a better understanding of the science behind earthquake hazard than using relatively short historical records alone. As in most geological problems, we need to use every possible clue we can to solve the enigma of earthquake occurrence.