
At the Victorian election held on the 29 November, Labor won a comfortable majority in the lower house. However, it was a different story in the upper house. The Coalition won 16 of the 40 seats, down 5 on the 2010 result, Labor 14, down 2, the Greens 5, up 2, the Shooters & Fishers 2, and the Sex Party, Democratic Labour Party (DLP) and Vote 1 Local Jobs each won one seat. As a result, if the Coalition opposes a bill, Labor will need the Greens and at least two of the other five cross-benchers to pass it.
The Coalition’s upper house vote was 36.1%, down 7.0% on 2010, Labor had 33.5%, down 1.9% and the Greens 10.8%, down 1.2%. All Others won 19.6%, up 10.2% on 2010. At the 2014 lower house elections, the major parties combined for an 80.1% vote, but could only manage a combined vote of 69.6% in the upper house. The difference between the major party vote in the lower house and upper house is 10.5%, much higher than the 2.5% it was in 2010.
The Victorian upper house has eight regions with an approximately equal population that each return five members. The table below shows the actual results for each region.
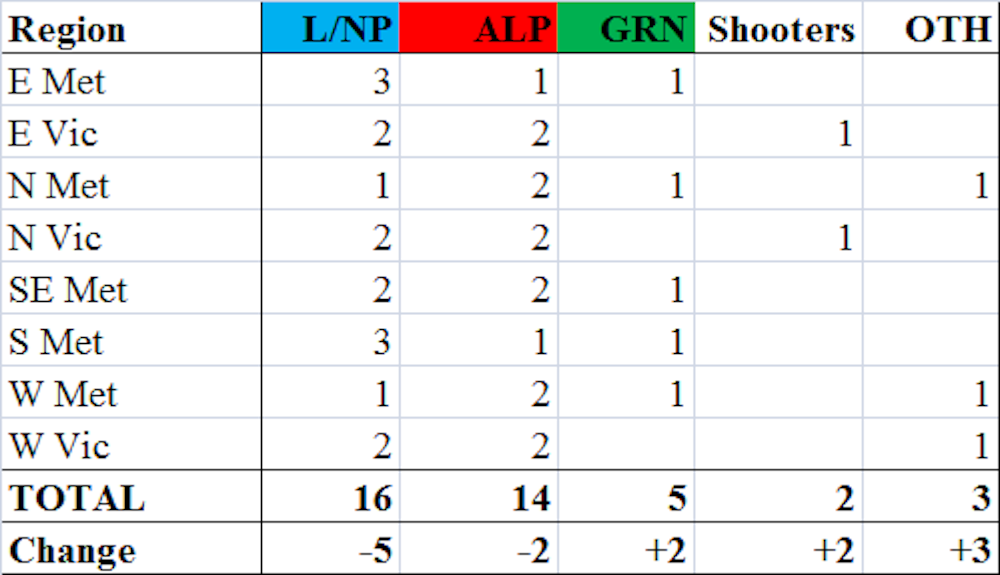
Others are the Sex Party in North Metro, the DLP in West Metro and Local Jobs in West Vic.
Here are some comments on these results, sourced mainly from Antony Green.
None of the five micro parties elected won more than 3.5% in their region, and Local Jobs won only 1.3%. That is a small fraction of the 16.7% quota requirement.
There were two very close results. In North Vic, Labor eliminated the Greens by 161 votes, and was elected on Greens preferences. Had Labor been excluded at that point, their preferences would have elected Country Alliance instead of the Greens. In South East Metro, the Sex Party was excluded by 223 votes at a critical point, resulting in the Greens winning instead of the Sex Party.
The ABC’s upper house calculator, which assumes that all votes are ticket votes, accurately predicted the results for seven of the eight regions, missing only in South East Metro, where it had the Sex Party winning the final seat instead of the Greens. This miss was caused by below the line voters not following the group voting tickets.
The Liberal Democratic Party (LDP) won over 4.5% in three regions, but in those regions the LDP had a favourable ballot paper position compared to the Liberals. In other regions, the LDP vote was under 2%. Similarly, the DLP won over 4% in North Vic, where they were in column A with the ALP in the last column; in the rest of the state, the DLP vote was around 2%, and they did worse in the other two country regions.
What If Voters Chose their Own Preferences?
The Victorian, WA and SA upper houses and the Federal Senate still use group voting tickets, in which parties control the preferences of the vast majority of their voters. In NSW, above the line optional preferential voting is used, which means that if voters only put a “1” above their party’s box, the vote will exhaust within that party. Voters can preference more parties if they wish by numbering “1”, “2”, “3”, etc, above the line.
If the Victorian upper house voting system used above the line optional preferential voting (OPV), it is highly unlikely that any of the micro parties would have won a seat. The highest statewide vote for any micro party was 3.1% for the LDP, and this was partly due to confusion with the Liberals. Many small parties would realise that they had no chance of winning seats under OPV, and would not contest. As a result, ballot papers would be less cluttered, so name confusion would not be the problem it sometimes is now.
Under OPV, primary votes would be much more important. This is the result I think would be most likely under OPV. In this case, Labor would only need the Greens to pass legislation that the Coalition opposed.
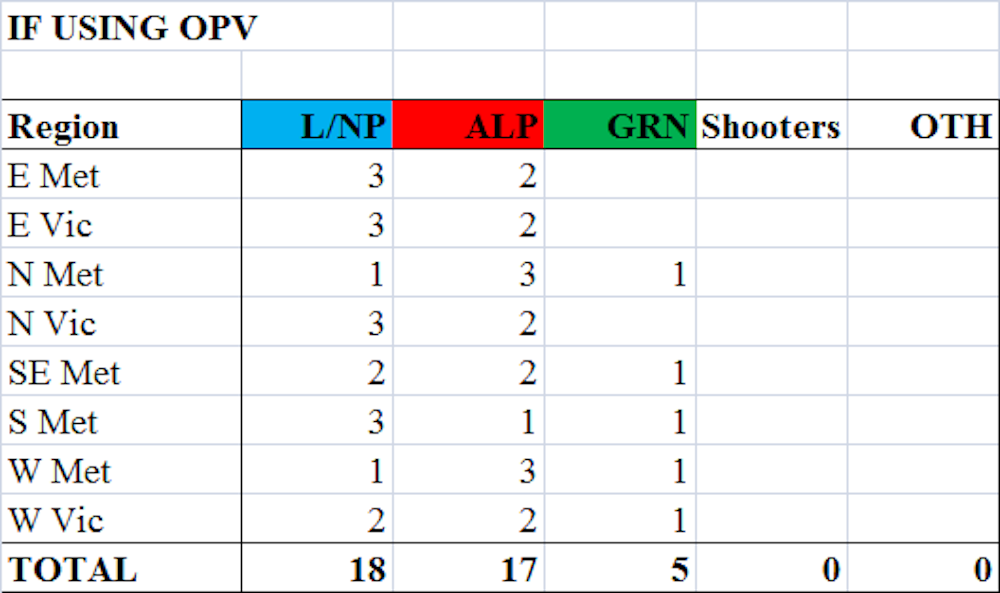
Here’s a region by region breakdown. All figures are from the ABC. A quota is 1/6 of the vote, or 16.7%
East Metro - Libs 2.74 quotas, ALP 1.72, Grn 0.63. Clear 3 Liberals, 2 Labor result, with Greens little chance of catching Labor.
East Vic - L/NP 2.50 quotas, ALP 1.74, Grn 0.51, LDP 0.28. Many LDP voters would be normal Coalition votes who accidentally voted for the LDP. As a result, Coalition vote is understated, and the likely result would be 3 Coalition, 2 Labor.
North Metro - ALP 2.42 quotas, Libs 1.31, Grn 1.11. Clear Labor 3, Liberals 1, Greens 1 result. Liberals no chance of catching Labor with Greens and other left parties to distribute.
North Vic - L/NP 2.47 quotas, ALP 1.58, Grn 0.46, DLP 0.25, Shooters 0.21. Some who voted for the DLP probably meant to vote for Labor. I think the Coalition would win enough conservative preferences to see off the Greens. Result: Coalition 3, Labor 2.
South East Metro - ALP 2.41 quotas, Libs 2.11, Grn 0.38. The last seat would be a contest between Labor and the Greens, and I think the Greens would win enough preferences from left parties.
South Metro - Libs 2.56 quotas, ALP 1.51, Grn 0.93, LDP 0.28. Clear Libs 3, Labor 1, Greens 1 result, with Labor no chance of catching Libs, as left preferences could choose Greens, and Liberal vote understated due to the LDP.
West Metro - ALP 2.64 quotas, Libs 1.41, Grn 0.62, LDP 0.33. This was the LDP’s best region, and I think much of their vote here belongs to the Liberals. If that is factored in, this is a close 3-way fight for two seats, with Labor and the Greens just ahead.
West Vic - L/NP 2.22 quotas, ALP 2.04, Grn 0.55. The Greens would win the last seat easily under OPV.
Only two of the eight regions have the same outcomes using OPV as they did with the actual results. This is because group voting tickets can allow parties with low votes to reach a quota by harnessing the preferences of other parties. Some may argue that the micro parties deserve some seats given that the total micro party vote was almost 20%. However, the most any individual micro party won was 3.1% by the LDP, and that vote was inflated by confusion with the Liberals. Given the choice, most people who vote for left wing micros would not preference right wing micros, and vice versa.
The above discussion does not absolve the major parties. Until the 2013 Federal election, there was generally only a few points difference between major party votes at lower and upper house elections. At the 2013 Federal election, the Coalition vote was almost 8% less in the Senate than in the House, though some of this was caused by name confusion with the LDP. At this election, the total major party vote was over 10% less in the upper house than the lower. It looks as if the major parties need to start campaigning in earnest for upper house elections, rather than just assuming the upper house results will be almost the same as the lower house results.
Major Party Percentages too Low on Electoral Commission Website
The Victorian Electoral Commission’s website currently gives Labor just 32.3% of the upper house vote. However, if you divide the number of Labor votes (1,143,774) by the total formal vote (3,418,280), you get a Labor vote % of 33.5%, NOT 32.3%! You only get 32.3% if you include the informal vote of 121,482, and divide by the total formal AND informal votes.
This mistake has not been made for the lower house, only the upper house. The result is that all parties have lower vote percentages than they should, but the major parties are the most affected. If the Others vote is calculated as 100 - Labor - Coalition - Greens, you would have an Others vote of 22%, instead of the actual 19.6%.
I am sure that this error does not affect the election of any candidates. Wikipedia has the correct percentages.
Update Tuesday night 23 December: The Electoral Commission has now fixed the upper house percentages, so they are now dividing by the total formal votes.