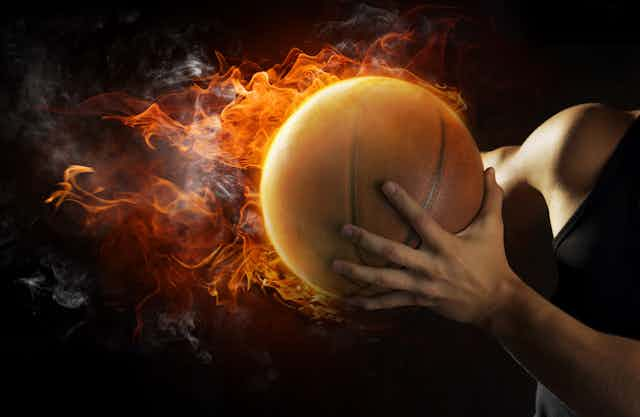


It’s NCAA basketball tournament season, known for its magical moments and the “March Madness” it can produce. Many fans remember Stephen Curry’s superhuman 2008 performance where he led underdog Davidson College to victory while nearly outscoring the entire determined Gonzaga team by himself in the second half. Was Curry’s magic merely a product of his skill, the match-ups and random luck, or was there something special within him that day?
Nearly every basketball player, coach or fan believes that some shooters have an uncanny tendency to experience the hot hand – also referred to as being “on fire,” “in the zone,” “in rhythm” or “unconscious.” The idea is that on occasion these players enter into a special state in which their ability to make shots is noticeably better than usual. When people see a streak, like Craig Hodges hitting 19 3-pointers in a row, or other exceptional performances, they typically attribute it to the hot hand.
The hot hand makes intuitive sense. For instance, you can probably recall a situation, in sports or otherwise, in which you felt like you had momentum on your side – your body was in sync, your mind was focused and you were in a confident mood. In these moments of flow success feels inevitable, and effortless.
However, if you go to the NCAA’s website, you’ll read that this intuition is incorrect – the hot hand does not exist. Belief in the hot hand is just a delusion that occurs because we as humans have a predisposition to see patterns in randomness; we see streakiness even though shooting data are essentially random. Indeed, this view has been held for the past 30 years among scientists who study judgment and decision-making. Even Nobel Prize winner Daniel Kahneman affirmed this consensus: “The hot hand is a massive and widespread cognitive illusion.”
Nevertheless, recent work has uncovered critical flaws in the research which underlies this consensus. In fact, these flaws are sufficient to not only invalidate the most compelling evidence against the hot hand, but even to vindicate the belief in streakiness.

Research made it the ‘hot hand fallacy’
In the landmark 1985 paper “The hot hand in basketball: On the misperception of random sequences,” psychologists Thomas Gilovich, Robert Vallone and Amos Tversky (GVT, for short) found that when studying basketball shooting data, the sequences of makes and misses are indistinguishable from the sequences of heads and tails one would expect to see from flipping a coin repeatedly.
Just as a gambler will get an occasional streak when flipping a coin, a basketball player will produce an occasional streak when shooting the ball. GVT concluded that the hot hand is a “cognitive illusion”; people’s tendency to detect patterns in randomness, to see perfectly typical streaks as atypical, led them to believe in an illusory hot hand.
GVT’s conclusion that the hot hand doesn’t exist was initially dismissed out of hand by practitioners; legendary Boston Celtics coach Red Auerbach famously said: “Who is this guy? So he makes a study. I couldn’t care less.” The academic response was no less critical, but Tversky and Gilovich successfully defended their work, while uncovering critical flaws in the studies that challenged it. While there remained some isolated skepticism, GVT’s result was accepted as the scientific consensus, and the “hot hand fallacy” was born.
Importantly, GVT found that professional practitioners (players and coaches) not only were victims of the fallacy, but that their belief in the hot hand was stubbornly fixed. The power of GVT’s result had a profound influence on how psychologists and economists think about decision-making in domains where information arrives over time. As GVT’s result was extrapolated into areas outside of basketball, the hot hand fallacy became a cultural meme. From financial investing to video gaming, the notion that momentum could exist in human performance came to be viewed as incorrect by default.
The pedantic “No, actually” commentators were given a license to throw cold water on the hot hand believers.
Taking another look at the probabilities
In what turns out to be an ironic twist, we’ve recently found this consensus view rests on a subtle – but crucial – misconception regarding the behavior of random sequences. In GVT’s critical test of hot hand shooting conducted on the Cornell University basketball team, they examined whether players shot better when on a streak of hits than when on a streak of misses. In this intuitive test, players’ field goal percentages were not markedly greater after streaks of makes than after streaks of misses.
GVT made the implicit assumption that the pattern they observed from the Cornell shooters is what you would expect to see if each player’s sequence of 100 shot outcomes were determined by coin flips. That is, the percentage of heads should be similar for the flips that follow streaks of heads, and the flips that follow streaks of misses.
Our surprising finding is that this appealing intuition is incorrect. For example, imagine flipping a coin 100 times and then collecting all the flips in which the preceding three flips are heads. While one would intuitively expect that the percentage of heads on these flips would be 50 percent, instead, it’s less.
Here’s why.
Suppose a researcher looks at the data from a sequence of 100 coin flips, collects all the flips for which the previous three flips are heads and inspects one of these flips. To visualize this, imagine the researcher taking these collected flips, putting them in a bucket and choosing one at random. The chance the chosen flip is a heads – equal to the percentage of heads in the bucket – we claim is less than 50 percent.

To see this, let’s say the researcher happens to choose flip 42 from the bucket. Now it’s true that if the researcher were to inspect flip 42 before examining the sequence, then the chance of it being heads would be exactly 50/50, as we intuitively expect. But the researcher looked at the sequence first, and collected flip 42 because it was one of the flips for which the previous three flips were heads. Why does this make it more likely that flip 42 would be tails rather than a heads?
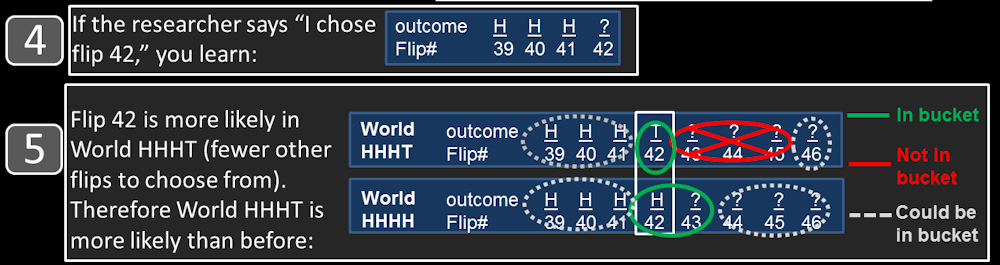
If flip 42 were heads, then flips 39, 40, 41 and 42 would be HHHH. This would mean that flip 43 would also follow three heads, and the researcher could have chosen flip 43 rather than flip 42 (but didn’t). If flip 42 were tails, then flips 39 through 42 would be HHHT, and the researcher would be restricted from choosing flip 43 (or 44, or 45). This implies that in the world in which flip 42 is tails (HHHT) flip 42 is more likely to be chosen as there are (on average) fewer eligible flips in the sequence from which to choose than in the world in which flip 42 is heads (HHHH).
This reasoning holds for any flip the researcher might choose from the bucket (unless it happens to be the final flip of the sequence). The world HHHT, in which the researcher has fewer eligible flips besides the chosen flip, restricts his choice more than world HHHH, and makes him more likely to choose the flip that he chose. This makes world HHHT more likely, and consequentially makes tails more likely than heads on the chosen flip.
In other words, selecting which part of the data to analyze based on information regarding where streaks are located within the data, restricts your choice, and changes the odds.
The complete proof can be found in our working paper that’s available online. Our reasoning here applies what’s known as the principle of restricted choice, which comes up in the card game bridge, and is the intuition behind the formal mathematical procedure for updating beliefs based on new information, Bayesian inference. In another one of our working papers, which links our result to various probability puzzles and statistical biases, we found that the simplest version of our problem is nearly equivalent to the famous Monty Hall problem, which stumped the eminent mathematician Paul Erdős and many other smart people.
We observed a similar phenomenon; smart people were convinced that the bias we found couldn’t be true, which led to interesting email exchanges and spirited posts to internet forums (TwoPlusTwo, Reddit, StackExchange) and the comment sections of academic blogs (Gelman, Lipton&Regan, Kahan, Landsburg, Novella, Rey Biel), newspapers (Wall Street Journal, The New York Times) and online magazines (Slate and NYMag).
The hot hand rises again
With this counterintuitive new finding in mind, let’s now go back to the GVT data. GVT divided shots into those that followed streaks of three (or more) makes, and streaks of three (or more) misses, and compared field goal percentages across these categories. Because of the surprising bias we discovered, their finding of only a negligibly higher field goal percentage for shots following a streak of makes (three percentage points), was, if you do the calculation, actually 11 percentage points higher than one would expect from a coin flip!

An 11 percentage point relative boost in shooting when on a hit-streak is not negligible. In fact, it is roughly equal to the difference in field goal percentage between the average and the very best 3-point shooter in the NBA. Thus, in contrast with what was originally found, GVT’s data reveal a substantial, and statistically significant, hot hand effect.
Importantly, this evidence in support of hot hand shooting is not unique. Indeed, in recent research we’ve found that this effect replicates in the NBA’s Three Point contest, as well in other controlled studies. Evidence from other researchers using free throw and game data corroborates this. Further, there’s a good chance the hot hand is more substantial than we estimate due to another subtle statistical issue called “measurement error,” which we discuss in the appendix of our paper.
Thus, surprisingly, these recent discoveries show that the practitioners were actually right all along. It’s OK to believe in the hot hand. While perhaps you shouldn’t get too carried away, you can believe in the magic and mystery of momentum in basketball and life in general, while still maintaining your intellectual respectability.